.NET OpenTelemetry Instrumentation
This document contains instructions on how to set up OpenTelemetry(OTel) instrumentation in your .NET application. OpenTelemetry, also known as OTel for short, is an open-source observability framework that can help you generate and collect telemetry data - traces, metrics, and logs from your .NET application.
OpenTelemetry .NET is the language-specific implementation of OpenTelemetry in .NET.
Once the telemetry data is generated, you can configure an exporter to send the data to SigNoz for monitoring and visualization.
There are three major steps to using OpenTelemetry:
- Instrumenting your .NET application with OpenTelemetry
- Configuring the exporter to send data to SigNoz
- Validating that configuration to ensure that data is being sent as expected.
In this tutorial, we will instrument a .NET application for traces and send it to SigNoz.
Requirements
.NET SDK (.NET 5.0 or Later)
Send Traces to SigNoz Cloud
Based on your application environment, you can choose the setup below to send traces to SigNoz Cloud.
Tthere are two ways to send data to SigNoz Cloud.
Send traces directly to SigNoz Cloud - No Code Automatic Instrumentation (recommended)
Step 1: Create a shell script with the following content You can either create a bash script with the following content or paste this directly into your terminal after replacing SERVICE_NAME, SIGNOZ_ENDPOINT and SIGNOZ_INGESTION_KEY .
# Download the bash script
curl -sSfL https://github.com/open-telemetry/opentelemetry-dotnet-instrumentation/releases/latest/download/otel-dotnet-auto-install.sh -O

# Install core files
sh ./otel-dotnet-auto-install.sh

# Enable execution for the instrumentation script
chmod +x $HOME/.otel-dotnet-auto/instrument.sh

# Setup the instrumentation for the current shell session
. $HOME/.otel-dotnet-auto/instrument.sh

# Run your application with instrumentation
OTEL_SERVICE_NAME=<SERVICE_NAME> OTEL_TRACES_EXPORTER=otlp OTEL_EXPORTER_OTLP_PROTOCOL=http/protobuf OTEL_RESOURCE_ATTRIBUTES=deployment.environment=staging,service.version=1.0.0 OTEL_EXPORTER_OTLP_ENDPOINT=<SIGNOZ_ENDPOINT> OTEL_EXPORTER_OTLP_HEADERS=signoz-ingestion-key=<SIGNOZ_INGESTION_KEY> ./MyNetApp
| Variable | Description |
|---|---|
| SERVICE_NAME * | Name you want to give to your rust application |
| SIGNOZ_ENDPOINT * | This is ingestion URL which you must have got in mail after registering on SigNoz cloud |
| SIGNOZ_ACCESS_TOKEN * | This is Ingestion Key which you must have got in mail after registering on SigNoz cloud |
If you are doing it on mac os , you will need to install coreutils, you can do it by using the following command
brew install coreutils
Send traces directly to SigNoz Cloud - Code Level Automatic Instrumentation
Step 1: Installing the OpenTelemetry dependency packages:
dotnet add package OpenTelemetry
dotnet add package OpenTelemetry.Exporter.OpenTelemetryProtocol
dotnet add package OpenTelemetry.Extensions.Hosting
dotnet add package OpenTelemetry.Instrumentation.Runtime
dotnet add package OpenTelemetry.Instrumentation.AspNetCore
dotnet add package OpenTelemetry.AutoInstrumentation
Step 2: Adding OpenTelemetry as a service and configuring exporter options in Program.cs:
In your Program.cs file, add OpenTelemetry as a service. Here, we are configuring these variables:
serviceName- It is the name of your service.otlpOptions.Endpoint- It is the endpoint for SigNoz Cloud.<SIGNOZ_INGESTION_KEY>- You will get your ingestion key when you sign up for SigNoz cloud.
Here’s a sample Program.cs file with the configured variables.
using System.Diagnostics;
using OpenTelemetry.Exporter;
using OpenTelemetry.Resources;
using OpenTelemetry.Trace;

var builder = WebApplication.CreateBuilder(args);

// Configure OpenTelemetry with tracing and auto-start.
builder.Services.AddOpenTelemetry()
    .ConfigureResource(resource =>
		resource.AddService(serviceName: "sample-net-app"))
    .WithTracing(tracing => tracing
        .AddAspNetCoreInstrumentation()
        .AddOtlpExporter(otlpOptions =>
        {
						//SigNoz Cloud Endpoint
            otlpOptions.Endpoint = new Uri("https://ingest.{region}.signoz.cloud:443");

            otlpOptions.Protocol = OtlpExportProtocol.Grpc;

						//SigNoz Cloud account Ingestion key
            string headerKey = "signoz-ingestion-key";
            string headerValue = "<SIGNOZ_INGESTION_KEY>";

            string formattedHeader = $"{headerKey}={headerValue}";
            otlpOptions.Headers = formattedHeader;
        }));

var app = builder.Build();

// The index route ("/") is set up to write out the OpenTelemetry trace information on the response:
app.MapGet("/", () => $"Hello World! OpenTelemetry Trace: {Activity.Current?.Id}");

app.Run();
Depending on the choice of your region for SigNoz cloud, the ingest endpoint will vary according to this table.
| Region | Endpoint |
|---|---|
| US | ingest.us.signoz.cloud:443 |
| IN | ingest.in.signoz.cloud:443 |
| EU | ingest.eu.signoz.cloud:443 |
The program uses the OpenTelemetry.Instrumentation.AspNetCore package to automatically create traces for incoming ASP.NET Core requests.
The OpenTelemetry.Exporter.Options get or set the target to which the exporter is going to send traces. Here, we’re configuring it to send traces to the SigNoz cloud. The target must be a valid Uri with the scheme (http or https) and host and may contain a port and a path.
This is done by configuring an OpenTelemetry TracerProvider using extension methods and setting it to auto-start when the host is started.
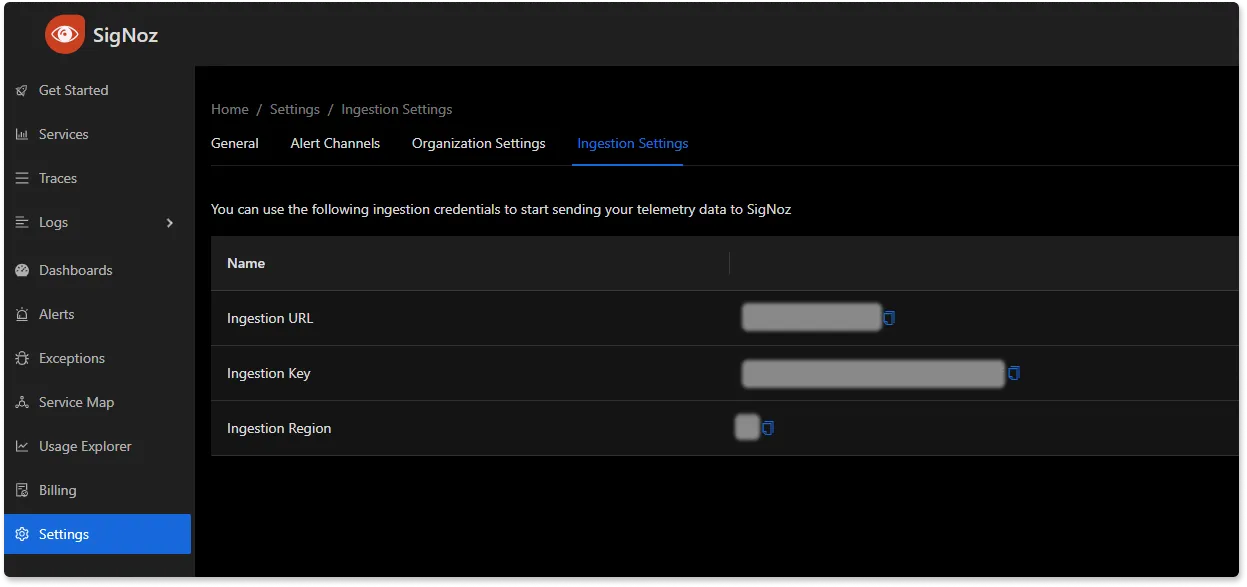
You can find your Signoz cloud address and ingestion key under the settings of your Signoz cloud account.

Step 3. Running the .NET application:
dotnet build
dotnet run
Step 4: Generating some load data and checking your application in SigNoz UI
Once your application is running, generate some traffic by interacting with it.
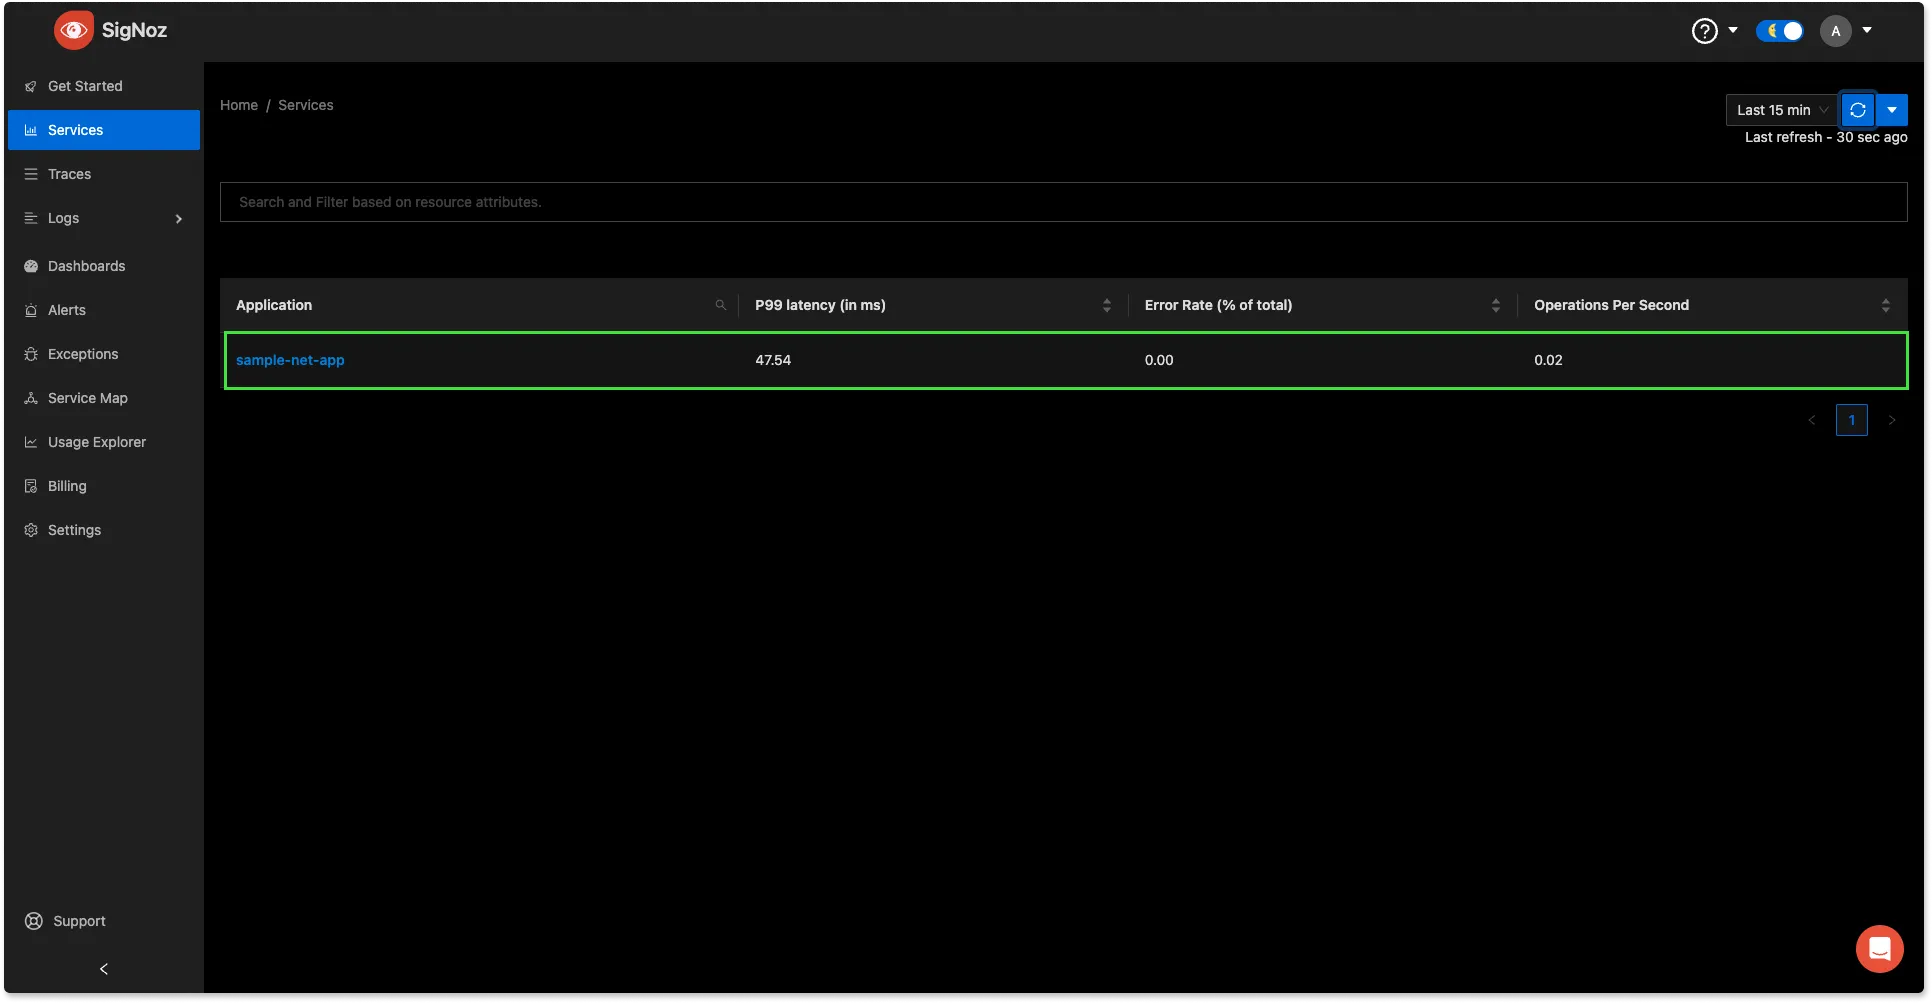
In the SigNoz account, open the Services tab. Hit the Refresh button on the top right corner, and your application should appear in the list of Applications. Ensure that you're checking data for the time range filter applied in the top right corner. You might have to wait for a few seconds before the data appears on SigNoz UI.

Send traces via OTel Collector binary
Send traces via OTel Collector binary - No Code Automatic Instrumentation
Step 1: Create a shell script with the following content You can either create a bash script with the following content or paste this directly into your terminal after replacing SERVICE_NAME, SIGNOZ_ENDPOINT and SIGNOZ_INGESTION_KEY .
# Download the bash script
curl -sSfL https://github.com/open-telemetry/opentelemetry-dotnet-instrumentation/releases/latest/download/otel-dotnet-auto-install.sh -O

# Install core files
sh ./otel-dotnet-auto-install.sh

# Enable execution for the instrumentation script
chmod +x $HOME/.otel-dotnet-auto/instrument.sh

# Setup the instrumentation for the current shell session
. $HOME/.otel-dotnet-auto/instrument.sh

# Run your application with instrumentation
OTEL_SERVICE_NAME=<SERVICE_NAME> OTEL_TRACES_EXPORTER=otlp OTEL_EXPORTER_OTLP_PROTOCOL=http/protobuf OTEL_RESOURCE_ATTRIBUTES=deployment.environment=staging,service.version=1.0.0 OTEL_EXPORTER_OTLP_ENDPOINT=http://localhost:4318/v1/traces ./MyNetApp
| Variable | Description |
|---|---|
| SERVICE_NAME * | Name you want to give to your rust application |
If you are doing it on mac os , you will need to install coreutils, you can do it by using the following command
brew install coreutils
Send traces via OTel Collector binary - Code Level Automatic Instrumentation
Step 1: Setting up OpenTelemetry Collector binary as an agent in your machine
OpenTelemetry Collector binary helps to collect logs, hostmetrics, resource and infra attributes. It is recommended to install OTel Collector binary to collect and send traces to SigNoz cloud. You can correlate signals and have rich contextual data through this way.
Go to setup OTel Collector binary to install Otel Collector as agent that will collect telemetry data from your sample dotnet app and send it to SigNoz cloud.
Step 2: Installing the OpenTelemetry dependency packages:
Install the following dependencies in your application.
dotnet add package OpenTelemetry
dotnet add package OpenTelemetry.Exporter.OpenTelemetryProtocol
dotnet add package OpenTelemetry.Extensions.Hosting
dotnet add package OpenTelemetry.Instrumentation.Runtime
dotnet add package OpenTelemetry.Instrumentation.AspNetCore
dotnet add package OpenTelemetry.AutoInstrumentation
Step 2: Adding OpenTelemetry as a service and configuring exporter options in Program.cs:
In your Program.cs file, add OpenTelemetry as a service. Here, we are configuring these variables:
serviceName- It is the name of your service.otlpOptions.Endpoint- It is the endpoint for your OTel Collector binary agent.
Here’s a sample Program.cs file with the configured variables.
using System.Diagnostics;
using OpenTelemetry.Exporter;
using OpenTelemetry.Resources;
using OpenTelemetry.Trace;

var builder = WebApplication.CreateBuilder(args);

// Configure OpenTelemetry with tracing and auto-start.
builder.Services.AddOpenTelemetry()
    .ConfigureResource(resource =>
		resource.AddService(serviceName: "sample-net-app"))
    .WithTracing(tracing => tracing
        .AddAspNetCoreInstrumentation()
        .AddOtlpExporter(otlpOptions =>
        {
            otlpOptions.Endpoint = new Uri("http://localhost:4317");

            otlpOptions.Protocol = OtlpExportProtocol.Grpc;
        }));

var app = builder.Build();

//The index route ("/") is set up to write out the OpenTelemetry trace information on the response:
app.MapGet("/", () => $"Hello World! OpenTelemetry Trace: {Activity.Current?.Id}");

app.Run();
The program uses the OpenTelemetry.Instrumentation.AspNetCore package to automatically create traces for incoming ASP.NET Core requests.
The OpenTelemetry.Exporter.Options get or set the target to which the exporter is going to send traces. Here, we’re configuring it to send traces to the OTel collector agent. The target must be a valid Uri with the scheme (http or https) and host and may contain a port and a path.
This is done by configuring an OpenTelemetry TracerProvider using extension methods and setting it to auto-start when the host is started.
Step 4. Running the .NET application:
dotnet build
dotnet run
Step 5: Generating some load data and checking your application in SigNoz UI
After the Otel collector is all set and running, and your too application is running, generate some traffic by interacting with it.
In the SigNoz account, open the Services tab. Hit the Refresh button on the top right corner, and your application should appear in the list of Applications. Ensure that you're checking data for the time range filter applied in the top right corner. You might have to wait for a few seconds before the data appears on SigNoz UI.

Troubleshooting
The console exporter prints data to the Console window. You can use it to verify if the instrumentation is properly set up or not.
Below are the steps on how to use the console exporter:
Step 1. Adding the OpenTelemetry console exporter package:
dotnet add package OpenTelemetry.Exporter.Console
Step 2. Adding the console exporter method:
using System.Diagnostics;
using OpenTelemetry.Exporter;
using OpenTelemetry.Resources;
using OpenTelemetry.Trace;

var builder = WebApplication.CreateBuilder(args);

// Configure OpenTelemetry with tracing and auto-start.
builder.Services.AddOpenTelemetry()
    .ConfigureResource(resource =>
		resource.AddService(serviceName: "sample-net-app"))
    .WithTracing(tracing => tracing
        .AddAspNetCoreInstrumentation()
        .AddOtlpExporter(otlpOptions =>
        {
						//SigNoz Cloud Endpoint
            otlpOptions.Endpoint = new Uri("https://ingest.{region}.signoz.cloud:443");

            otlpOptions.Protocol = OtlpExportProtocol.Grpc;

						//SigNoz Cloud account Ingestion key
            string headerKey = "signoz-ingestion-key";
            string headerValue = "<SIGNOZ_INGESTION_KEY>";

            string formattedHeader = $"{headerKey}={headerValue}";
            otlpOptions.Headers = formattedHeader;
        })
				.AddConsoleExporter());

var app = builder.Build();

//The index route ("/") is set up to write out the OpenTelemetry trace information on the response:
app.MapGet("/", () => $"Hello World! OpenTelemetry Trace: {Activity.Current?.Id}");

app.Run();
Monitor the application on the console. You will be able to see the trace output as below:
info: Microsoft.Hosting.Lifetime[14]
      Now listening on: https://localhost:7062
info: Microsoft.Hosting.Lifetime[14]
      Now listening on: http://localhost:5017
info: Microsoft.Hosting.Lifetime[0]
      Application started. Press Ctrl+C to shut down.
info: Microsoft.Hosting.Lifetime[0]
      Hosting environment: Development
info: Microsoft.Hosting.Lifetime[0]
      Content root path: C:\sample-app2
Activity.TraceId:            e1c2b70e9f39c6cc15d5d94b75412b70
Activity.SpanId:             17da84c0833e0075
Activity.TraceFlags:         Recorded
Activity.ActivitySourceName: Microsoft.AspNetCore
Activity.DisplayName:        /
Activity.Kind:               Server
Activity.StartTime:          2023-11-05T19:59:39.7875151Z
Activity.Duration:           00:00:00.2548901
Activity.Tags:
    net.host.name: localhost
    net.host.port: 7062
    http.method: GET
    http.scheme: https
    http.target: /
    http.url: https://localhost:7062/
    http.flavor: 2.0
    http.user_agent: Mozilla/5.0 (Windows NT 10.0; Win64; x64) AppleWebKit/537.36 (KHTML, like Gecko) Chrome/118.0.0.0 Safari/537.36
    http.status_code: 200
Resource associated with Activity:
    service.name: sample-app2
    service.instance.id: 44a34277-d46e-4758-b4f0-91b5a9435a4c
    telemetry.sdk.name: opentelemetry
    telemetry.sdk.language: dotnet
    telemetry.sdk.version: 1.6.0
Frequently Asked Questions
How to find what to use in
IP of SigNozif I have installed SigNoz in Kubernetes cluster?Based on where you have installed your application and where you have installed SigNoz, you need to find the right value for this. Please use this grid to find the value you should use for
IP of SigNozI am sending data from my application to SigNoz, but I don't see any events or graphs in the SigNoz dashboard. What should I do?
This could be because of one of the following reasons:
Your application is generating telemetry data, but not able to connect with SigNoz installation
Please use this troubleshooting guide to find if your application is able to access SigNoz installation and send data to it.
Your application is not actually generating telemetry data
Please check if the application is generating telemetry data first. You can use
Console Exporterto just print your telemetry data in console first. Join our Slack Community if you need help on how to export your telemetry data in consoleYour SigNoz installation is not running or behind a firewall
Please double check if the pods in SigNoz installation are running fine.
docker psorkubectl get pods -n platformare your friends for this.
What Cloud Endpoint Should I Use?
The primary method for sending data to SigNoz Cloud is through OTLP exporters. You can either send the data directly from your application using the exporters available in SDKs/language agents or send the data to a collector agent, which batches/enriches telemetry and sends it to the Cloud.
My Collector Sends Data to SigNoz Cloud
Using gRPC Exporter
The endpoint should be ingest.{region}.signoz.cloud:443, where {region} should be replaced with in, us, or eu. Note that the exporter endpoint doesn't require a scheme for the gRPC exporter in the collector.
# Sample config with `us` region
exporters:
    otlp:
        endpoint: "ingest.us.signoz.cloud:443"
        tls:
            insecure: false
        headers:
            "signoz-ingestion-key": "<SIGNOZ_INGESTION_KEY>"
Using HTTP Exporter
The endpoint should be https://ingest.{region}.signoz.cloud:443, where {region} should be replaced with in, us, or eu. Note that the endpoint includes the scheme https for the HTTP exporter in the collector.
# Sample config with `us` region
exporters:
    otlphttp:
        endpoint: "https://ingest.us.signoz.cloud:443"
        tls:
            insecure: false
        headers:
            "signoz-ingestion-key": "<SIGNOZ_INGESTION_KEY>"
My Application Sends Data to SigNoz Cloud
The endpoint should be configured either with environment variables or in the SDK setup code.
Using Environment Variables
Using gRPC Exporter
Examples with us region
OTEL_EXPORTER_OTLP_PROTOCOL=grpc OTEL_EXPORTER_OTLP_ENDPOINT=https://ingest.us.signoz.cloud:443 OTEL_EXPORTER_OTLP_HEADERS=signoz-ingestion-key=<SIGNOZ_INGESTION_KEY>
Using HTTP Exporter
OTEL_EXPORTER_OTLP_PROTOCOL=http/protobuf OTEL_EXPORTER_OTLP_ENDPOINT=https://ingest.us.signoz.cloud:443 OTEL_EXPORTER_OTLP_HEADERS=signoz-ingestion-key=<SIGNOZ_INGESTION_KEY>
Configuring Endpoint in Code
Please refer to the agent documentation.
Sending Data from a Third-Party Service
The endpoint configuration here depends on the export protocol supported by the third-party service. They may support either gRPC, HTTP, or both. Generally, you will need to adjust the host and port. The host address should be ingest.{region}.signoz.cloud:443, where {region} should be replaced with in, us, or eu, and port 443 should be used.
