Logs Quick Filters
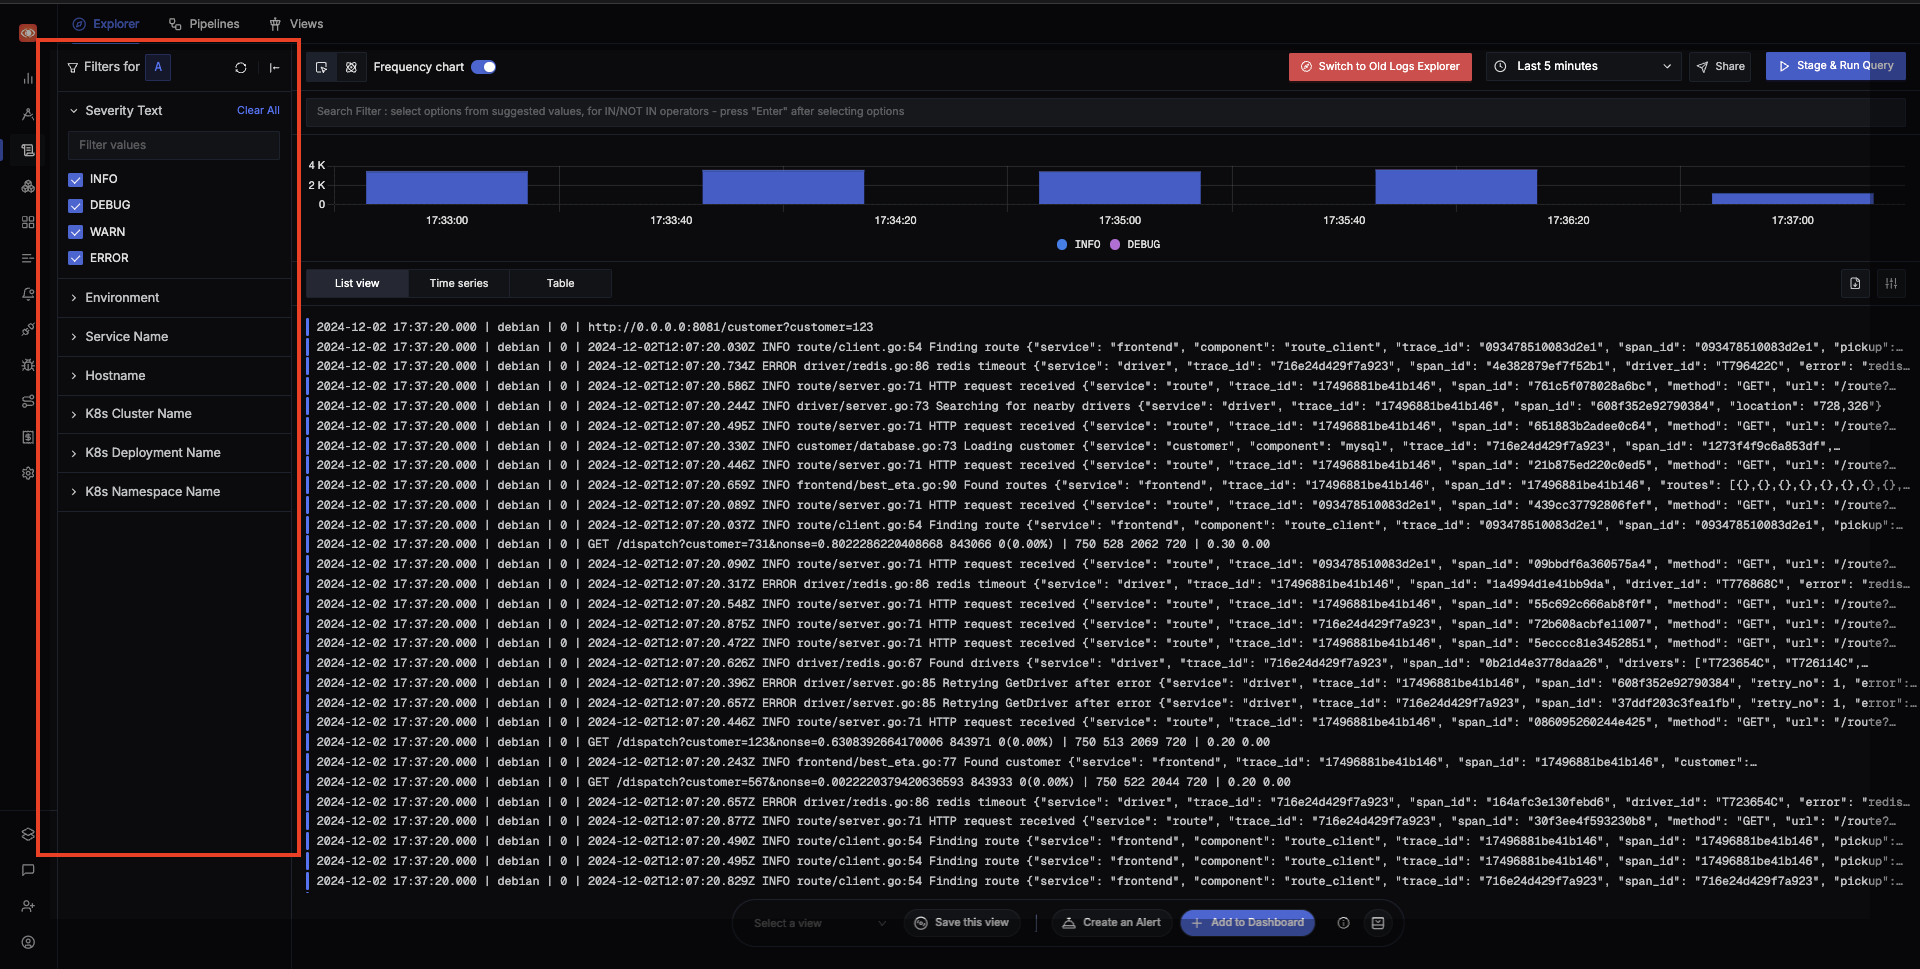
The Logs Explorer comes with quick filters which allows filtering of logs based on key attributes making it easier to analyze and debug applications. Below is a detailed explanation of the available filters and instructions on how to use them.

Available Filters
There are multiple filtering options available, with each filter mapped to a specific OpenTelemetry attribute. Here’s a list of the available filters:
Severity Text
- Description: Filter logs based on their severity text.
- Usage: Useful for quickly filtering in FATAL logs when some incident occurs or filter in DEBUG logs when debugging some issue.
- OTel Attribute: Maps to
severity_textopentelemetry attribute.
Environment
- Description: Filter logs based on the source environment.
- Usage: Useful for filtering in/out logs coming from different environments. Example - Production / Staging / Development etc.
- OTel Attribute: Maps to
deployment.environmentopentelemetry resource attribute.
Service Name
- Description: Filter logs by the name of the service that generated them.
- Usage: Select from a list of service names to isolate logs from a specific service. This can be helpful in microservices architectures where multiple services generate logs.
- OTel Attribute: Maps to
service.nameopentelemetry resource attribute.
Hostname
- Description: Filter logs based on the hostname of the machine that generated the logs.
- Usage: This filter allows you to isolate logs from specific hosts, which is particularly useful in environments with multiple servers or instances. For example, you can filter logs to view only those generated by a particular server during a specific time frame.
- OTel Attribute: Maps to
host.nameopentelemetry resource attribute.
K8s Pod Name
- Description: Filter logs based on the name of the Kubernetes pod that generated them.
- Usage: This filter allows you to isolate logs from specific pods, which is particularly useful in environments with multiple pods running the same service.
- OTel Attribute: Maps to
k8s.pod.nameopentelemetry resource attribute.
K8s Node Name
- Description: Filter logs based on the name of the Kubernetes node that generated them.
- Usage: This filter helps in isolating logs from specific nodes, which can be useful for debugging issues related to particular nodes in a cluster.
- OTel Attribute: Maps to
k8s.node.nameopentelemetry resource attribute.
K8s Cluster Name
- Description: Filter logs based on the name of the Kubernetes cluster that generated them.
- Usage: This filter allows you to isolate logs from specific clusters, which is particularly useful in environments with multiple clusters running different services.
- OTel Attribute: Maps to
k8s.cluster.nameopentelemetry resource attribute.
For mapping attributes from log body to the above attributes use log pipelines
How to use quick filters
Accessing Filters: Open the logs explorer and locate the quick filters panel on the left side.
Selecting Filters: Click on the desired filter category to expand it. For example, click on "K8s Cluster Name" to select a particular cluster.
Setting Filter Values: Select the appropriate values for the filter. For instance, you can select specific severity text.
Applying Filters: Once you set the filter values, the Logs Explorer will automatically update the displayed logs based on the selected filters.
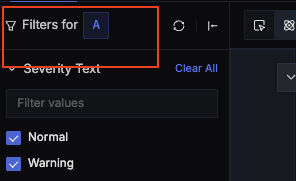
Multiple Queries Filters: If there are multiple queries, the
Filters Forsection will display the query name which is currently in sync with the filter and all the filter actions will be applied to this query.

How to change sync in Multiple Queries: The last interacted query will be in sync with quick filter. Interact with any query to sync it with the filters bar.
Clearing Filters: If you need to reset a filter, click on the "Clear All" option next to the filter category. You can also clear all applied filters at once by clicking on a Reset button available at the top. It will reset the filters for the query it is in sync with.
