OpenTelemetry Binary Usage in Virtual Machine
Overview
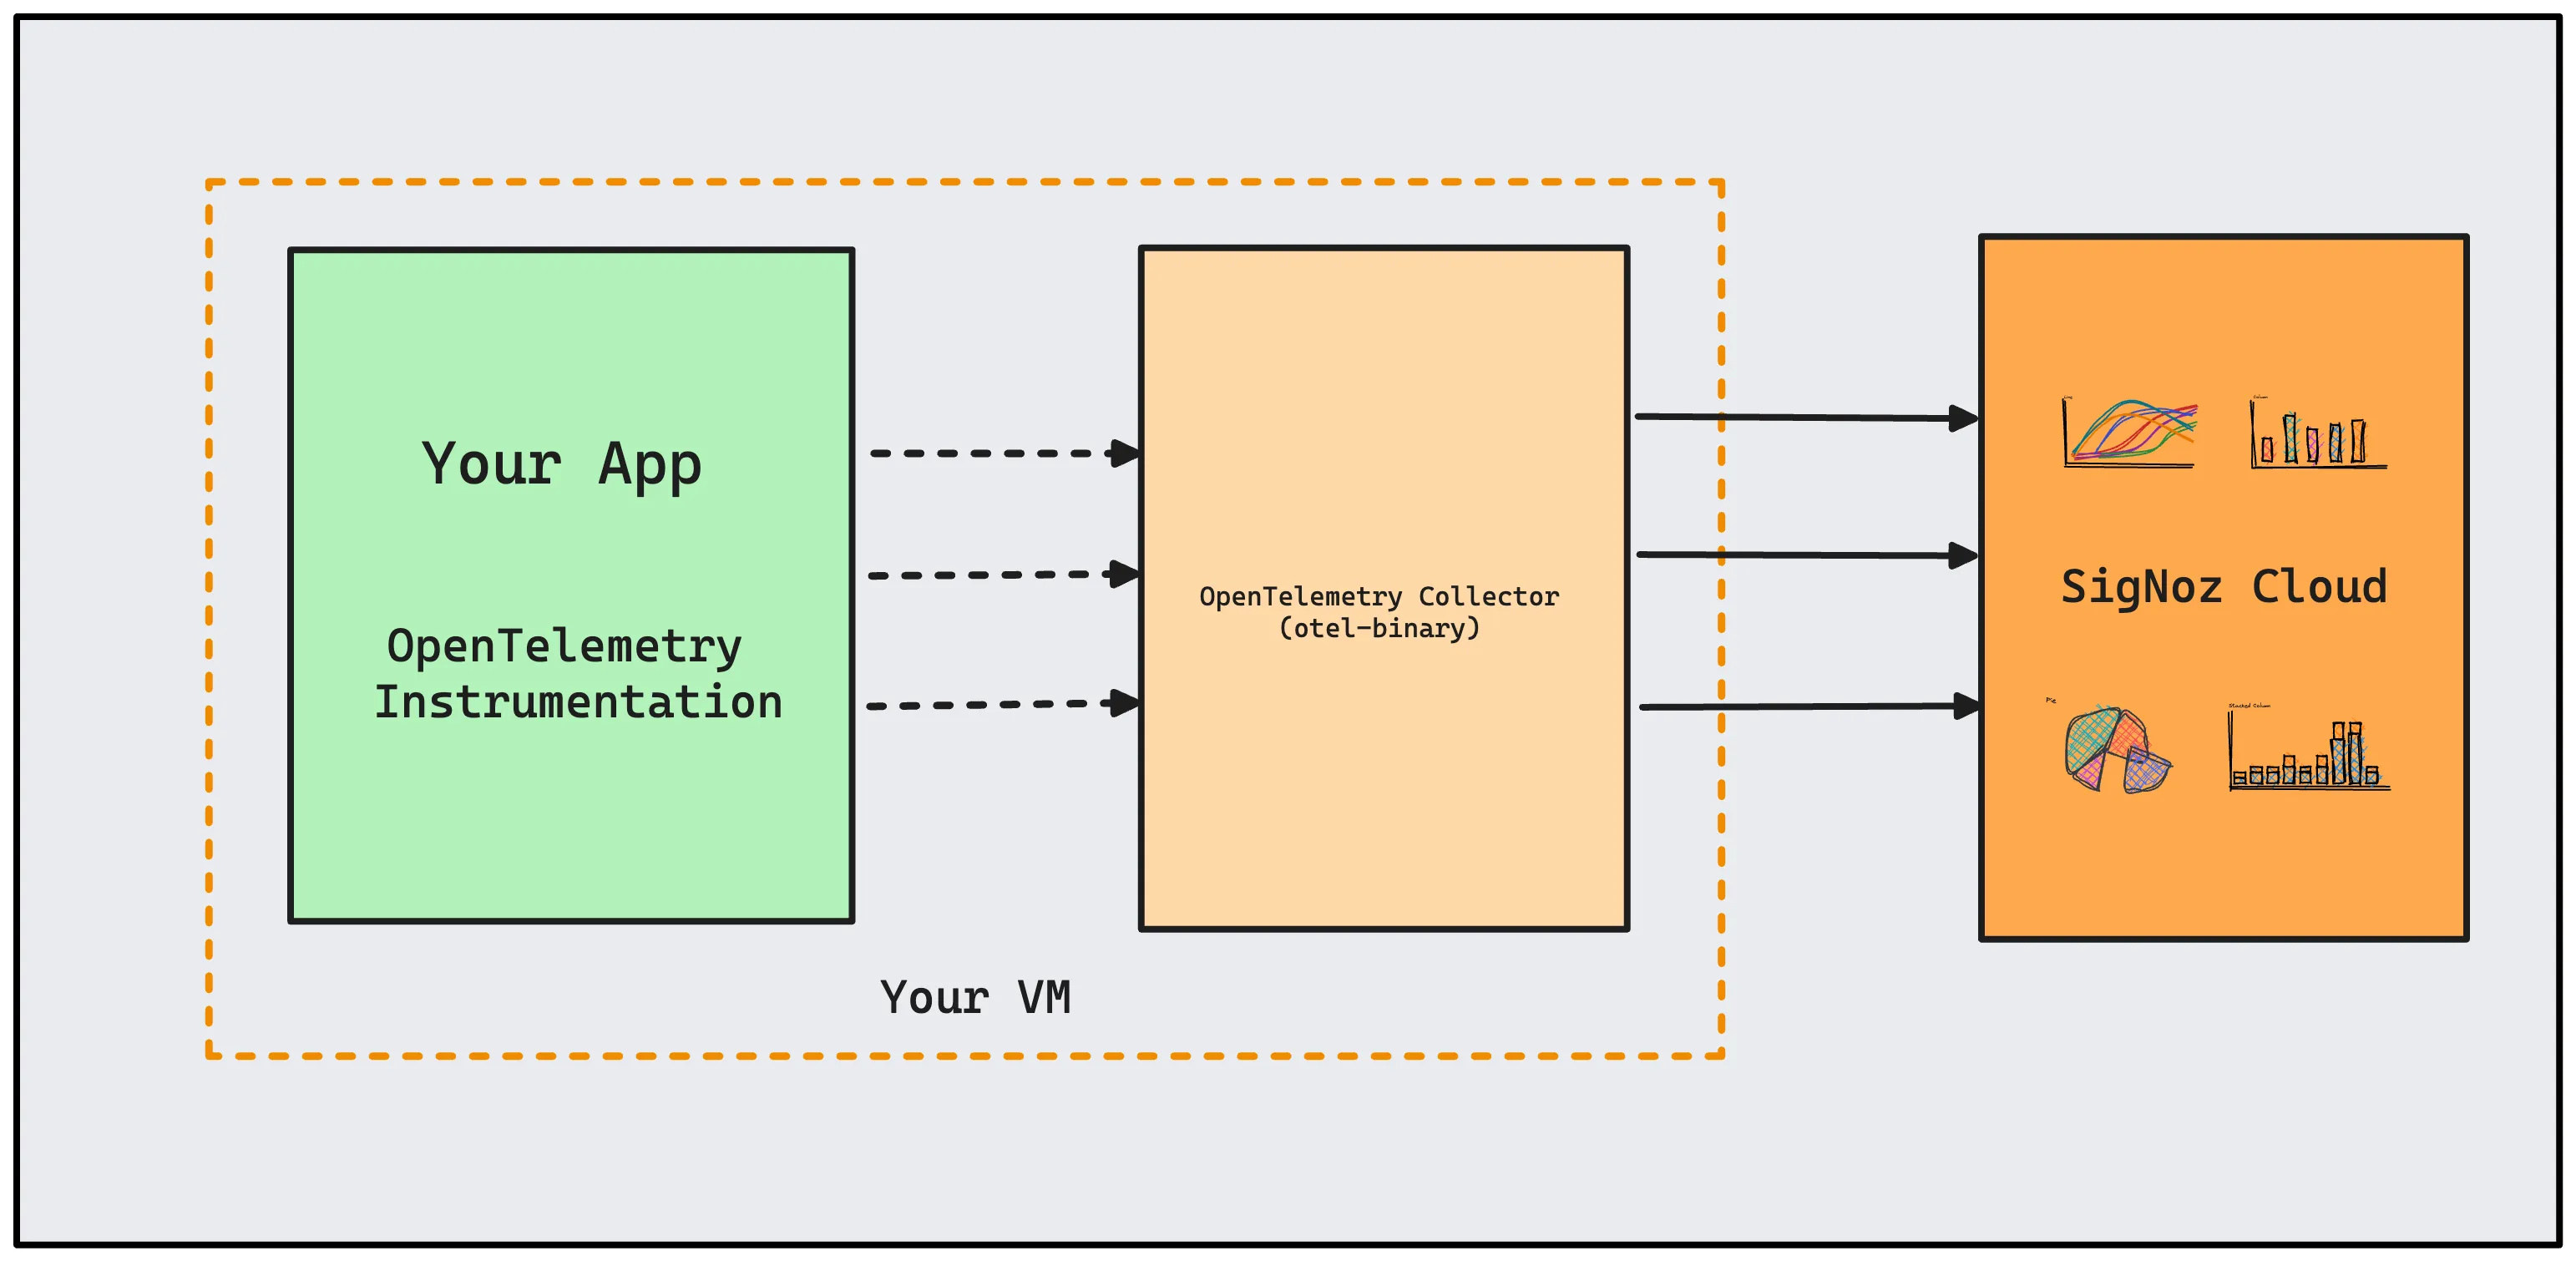
This tutorial shows how you can deploy OpenTelemetry binary as an agent, which collects telemetry data. Data such as traces, metrics and logs generated by applications most likely running in the same virtual machine (VM).
It can also be used for collecting data from other VMs in the same cluster, data center or region, however, binary is not recommended in that scenario but container or deployment which can be easily scaled.
In this guide, you will also learn to set up a hostmetrics receiver to collect metrics from the VM and view in SigNoz.
Setup Otel Collector as agent
OpenTelemetry-instrumented applications in a VM can send data to the otel-binary agent running in the same VM. The OTel agent can then be configured to send data to the SigNoz cloud.

Here are the steps to set up OpenTelemetry binary as an agent.
Download otel-collector tar.gz for your architecture
wget https://github.com/open-telemetry/opentelemetry-collector-releases/releases/download/v0.88.0/otelcol-contrib_0.88.0_linux_amd64.tar.gzExtract otel-collector tar.gz to the
otelcol-contribfoldermkdir otelcol-contrib && tar xvzf otelcol-contrib_0.88.0_linux_amd64.tar.gz -C otelcol-contribCreate
config.yamlin folderotelcol-contribwith the below content in it. ReplaceSIGNOZ_INGESTION_KEYwith what is provided by SigNoz:receivers: otlp: protocols: grpc: endpoint: 0.0.0.0:4317 http: endpoint: 0.0.0.0:4318 hostmetrics: collection_interval: 60s scrapers: cpu: {} disk: {} load: {} filesystem: {} memory: {} network: {} paging: {} process: mute_process_name_error: true mute_process_exe_error: true mute_process_io_error: true processes: {} prometheus: config: global: scrape_interval: 60s scrape_configs: - job_name: otel-collector-binary static_configs: - targets: # - localhost:8888 processors: batch: send_batch_size: 1000 timeout: 10s # Ref: https://github.com/open-telemetry/opentelemetry-collector-contrib/blob/main/processor/resourcedetectionprocessor/README.md resourcedetection: detectors: [env, system] # Before system detector, include ec2 for AWS, gcp for GCP and azure for Azure. # Using OTEL_RESOURCE_ATTRIBUTES envvar, env detector adds custom labels. timeout: 2s system: hostname_sources: [os] # alternatively, use [dns,os] for setting FQDN as host.name and os as fallback extensions: health_check: {} zpages: {} exporters: otlp: endpoint: "ingest.{region}.signoz.cloud:443" tls: insecure: false headers: "signoz-ingestion-key": "<SIGNOZ_INGESTION_KEY>" logging: verbosity: normal service: telemetry: metrics: address: 0.0.0.0:8888 extensions: [health_check, zpages] pipelines: metrics: receivers: [otlp] processors: [batch] exporters: [otlp] metrics/internal: receivers: [prometheus, hostmetrics] processors: [resourcedetection, batch] exporters: [otlp] traces: receivers: [otlp] processors: [batch] exporters: [otlp] logs: receivers: [otlp] processors: [batch] exporters: [otlp]Depending on the choice of your region for SigNoz cloud, the otlp endpoint will vary according to this table.
Region Endpoint US ingest.us.signoz.cloud:443 IN ingest.in.signoz.cloud:443 EU ingest.eu.signoz.cloud:443 Once we are done with the above configurations, we can now run the collector service with the following command:
From the
otelcol-contrib, run the following command:./otelcol-contrib --config ./config.yamlRun in background
If you want to run otel collector process in the background:
./otelcol-contrib --config ./config.yaml &> otelcol-output.log & echo "$!" > otel-pidThe above command sends the output of the otel-collector to
otelcol-output.logfile and prints the process id of the background running otel collector process to the otel-pid file.If you want to see the output of the logs you’ve just set up for the background process, you may look it up with:
tail -f -n 50 otelcol-output.logtail 50 will give the last 50 lines from the file
otelcol-output.logYou can stop the collector service
otelcolwhen running in backgorund, with the following command:kill "$(< otel-pid)"
Test Sending Traces
OpenTelemetry collector binary should be able to forward all types of telemetry data received: traces, metrics, and logs, to SigNoz OTLP endpoint via gRPC.
Let's send sample traces to the otelcol using telemetrygen.
To install telemetrygen binary:
go install github.com/open-telemetry/opentelemetry-collector-contrib/cmd/telemetrygen@latest
To send trace data using telemetrygen, execute the command below:
telemetrygen traces --traces 1 --otlp-endpoint localhost:4317 --otlp-insecure
Output should look like this:
...
2023-03-15T11:04:38.967+0545    INFO    channelz/funcs.go:340   [core][Channel #1] Channel Connectivity change to READY {"system": "grpc", "grpc_log": true}
2023-03-15T11:04:38.968+0545    INFO    traces/traces.go:124    generation of traces isn't being throttled
2023-03-15T11:04:38.968+0545    INFO    traces/worker.go:90     traces generated        {"worker": 0, "traces": 1}
2023-03-15T11:04:38.969+0545    INFO    traces/traces.go:87     stop the batch span processor
2023-03-15T11:04:38.983+0545    INFO    channelz/funcs.go:340   [core][Channel #1] Channel Connectivity change to SHUTDOWN      {"system": "grpc", "grpc_log": true}
2023-03-15T11:04:38.984+0545    INFO    channelz/funcs.go:340   [core][Channel #1 SubChannel #2] Subchannel Connectivity change to SHUTDOWN     {"system": "grpc", "grpc_log": true}
2023-03-15T11:04:38.984+0545    INFO    channelz/funcs.go:340   [core][Channel #1 SubChannel #2] Subchannel deleted     {"system": "grpc", "grpc_log": true}
2023-03-15T11:04:38.984+0545    INFO    channelz/funcs.go:340   [core][Channel #1] Channel deleted      {"system": "grpc", "grpc_log": true}
2023-03-15T11:04:38.984+0545    INFO    traces/traces.go:79     stopping the exporter
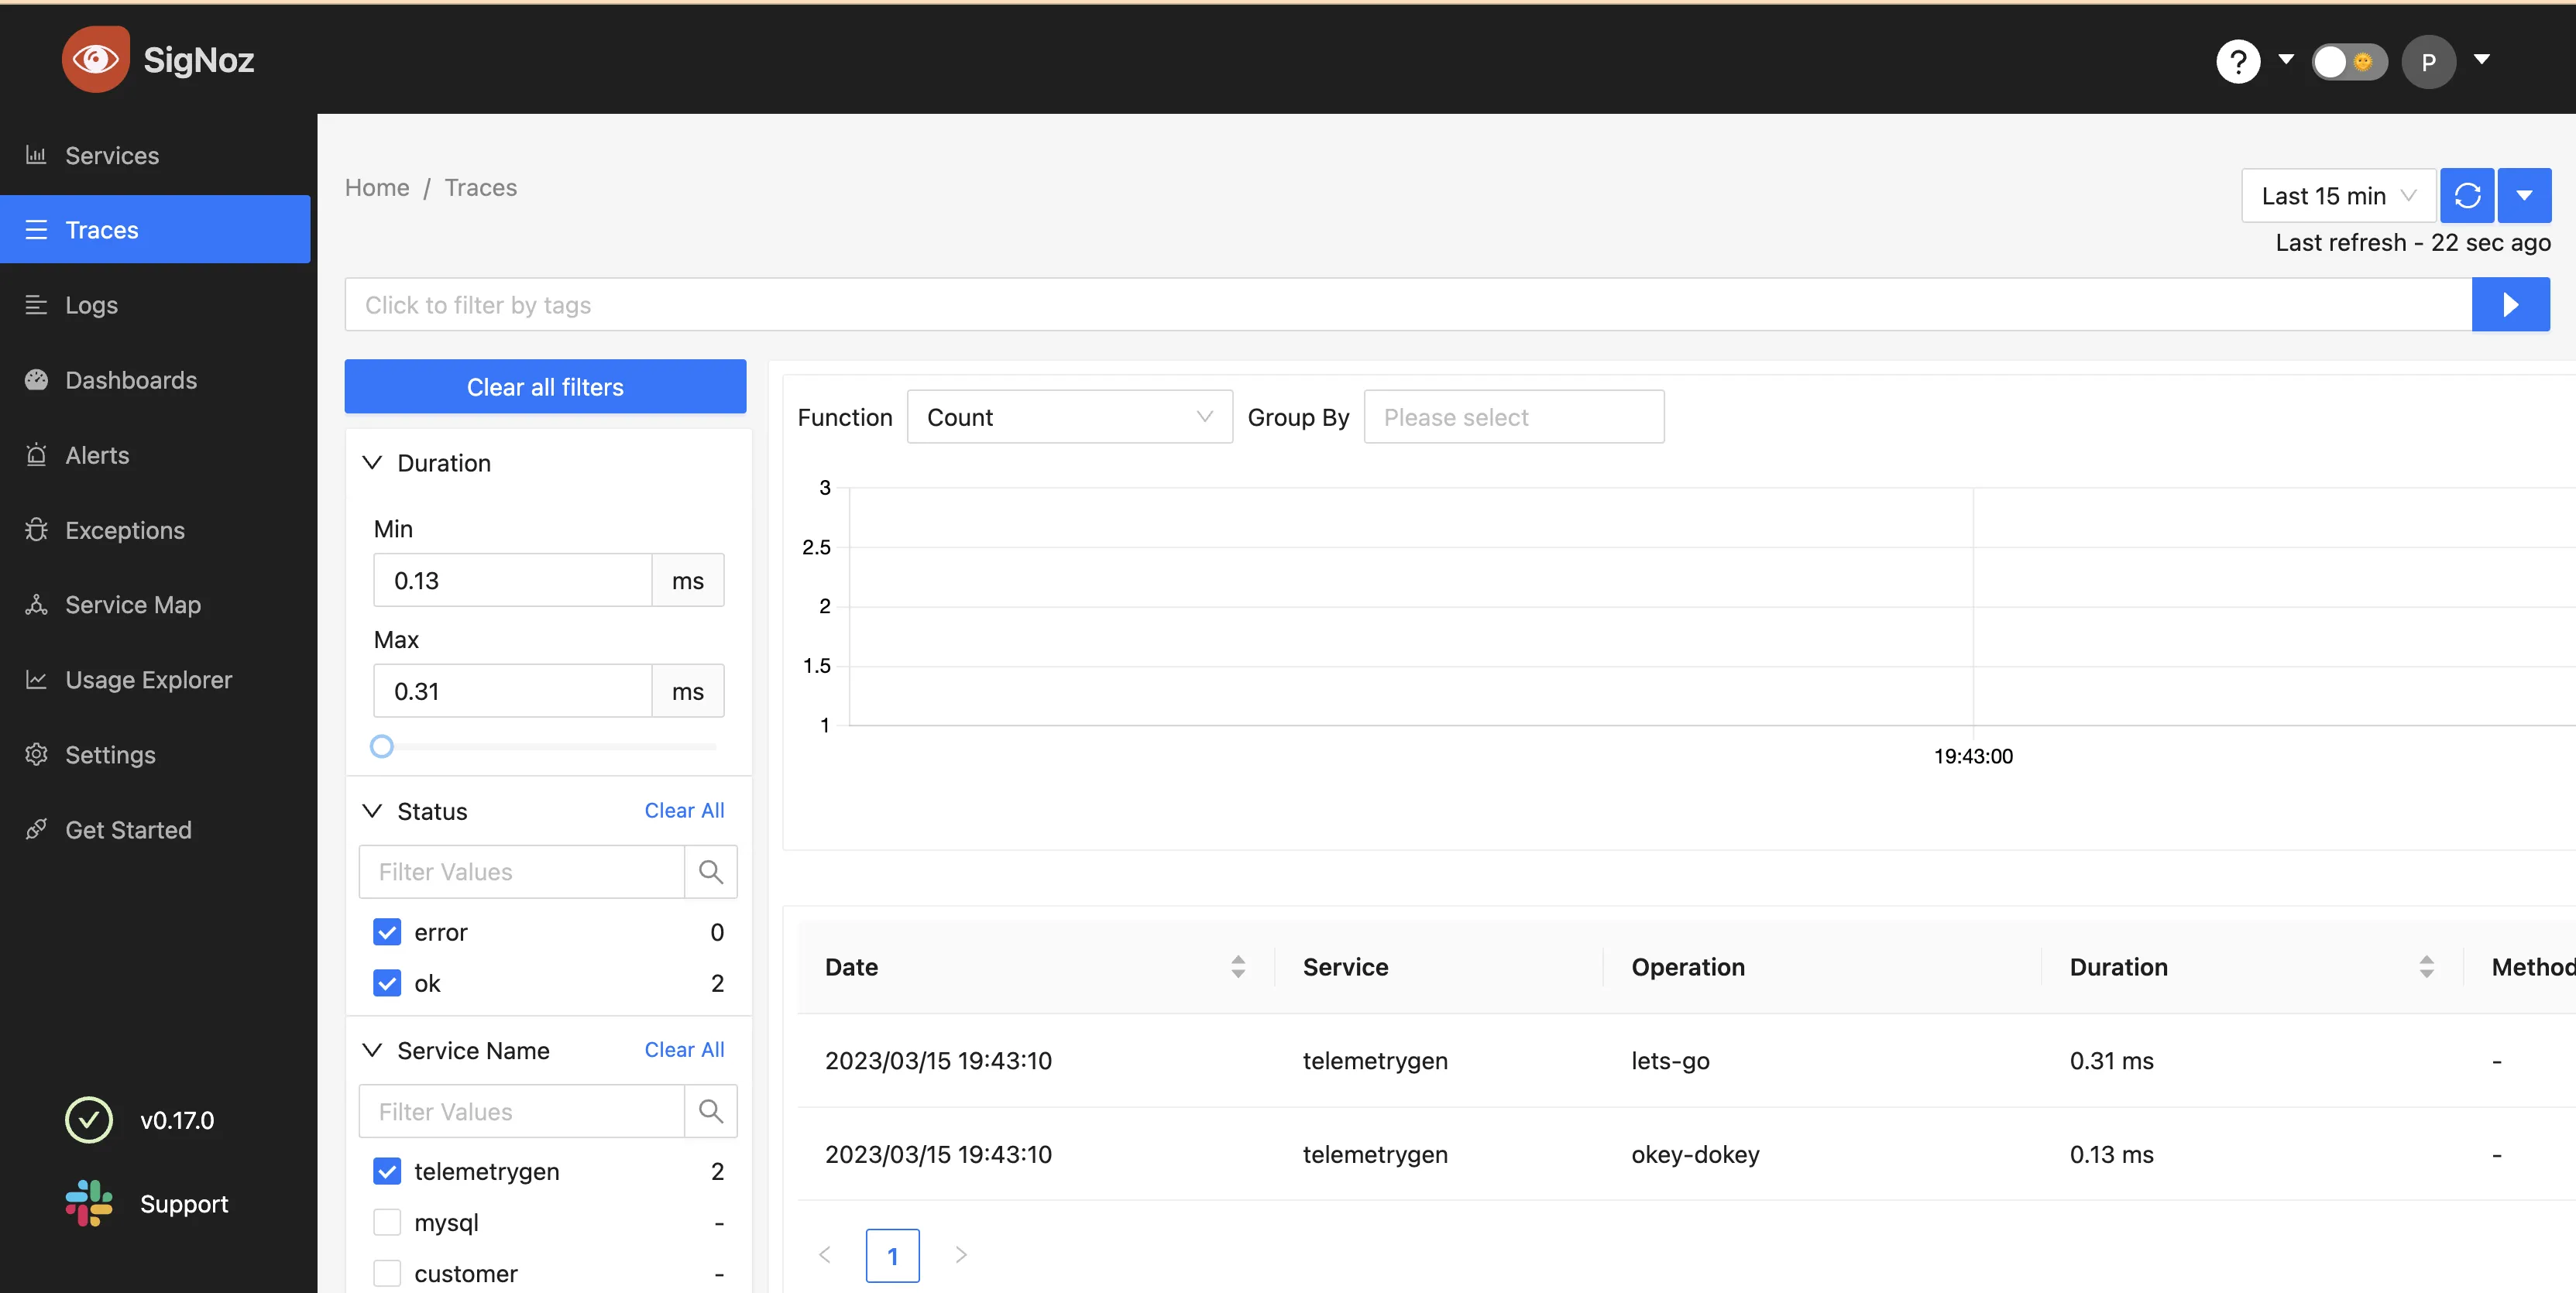
If the SigNoz endpoint in the configuration is set correctly and accessible, you should be able to see the traces sent via OpenTelemetry collector in VM from telemetrygen in the SigNoz UI.

HostMetrics Dashboard
To setup the Hostmetrics Dashboard, check the docs here.
List of metrics
Hostmetrics
- system_network_connections
- system_disk_weighted_io_time
- system_disk_merged
- system_disk_operation_time
- system_disk_pending_operations
- system_disk_io_time
- system_disk_operations
- system_disk_io
- system_filesystem_inodes_usage
- system_filesystem_usage
- system_cpu_time
- system_memory_usage
- system_network_packets
- system_network_dropped
- system_network_io
- system_network_errors
- system_cpu_load_average_5m
- system_cpu_load_average_15m
- system_cpu_load_average_1m
