Logs
Overview
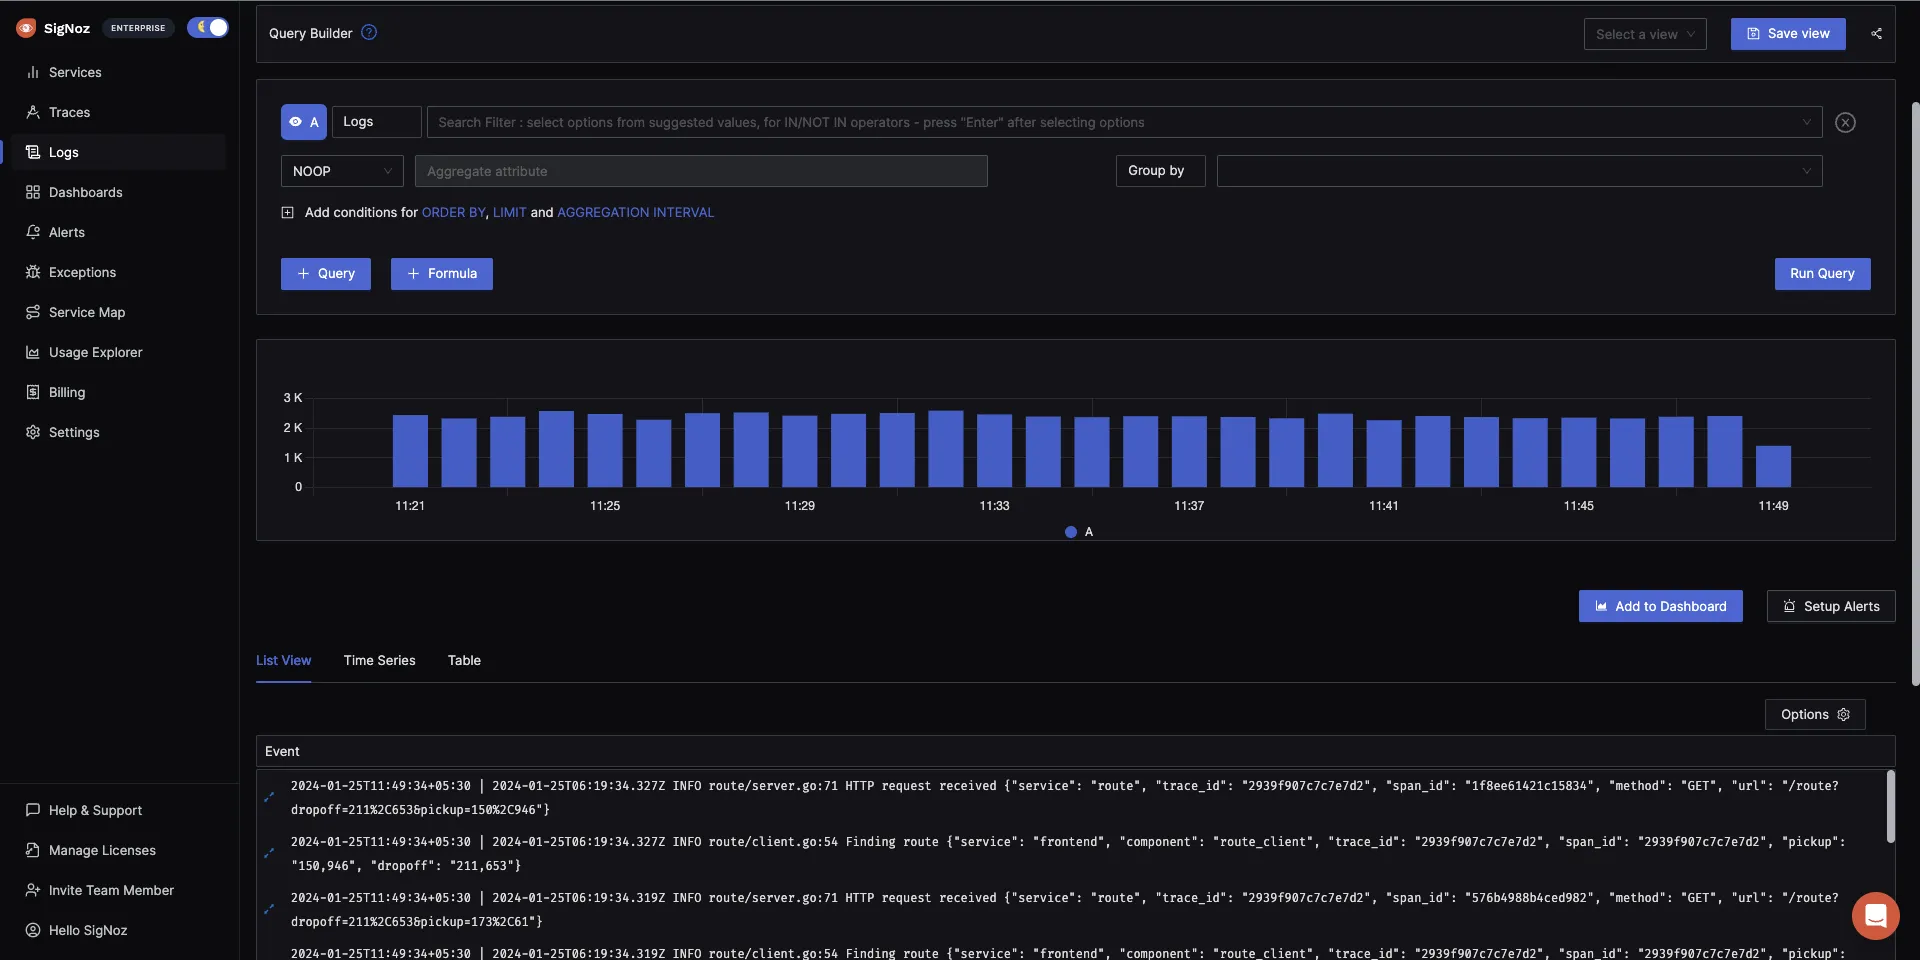
Of all telemetry signals, logs have probably the biggest legacy. Most programming languages have built-in logging capabilities or well-known, widely used logging libraries. SigNoz natively supports OpenTelemetry for collecting logs. OpenTelemetry is a open source standard for generating and collecting telemetry data.
OpenTelemetry logs support is added with the philosophy that it should support legacy logs and logging libraries as well as provide improvements and better integration with the rest of the observability world where possible.
At SigNoz we follow OpenTelemetry approach for logs. All the features that are present with OpenTelemetry for logs is supported by SigNoz. We have done optimizations on the collector side for adding different features for logs in SigNoz. But all the documentation for OpenTelemetry logs remains valid for SigNoz.
Collecting Logs in SigNoz Cloud
Sending logs to the SigNoz cloud depends on what environment your application is running on. In most cases, you need to install OpenTelemetry Collector to collect and send logs to SigNoz.
If you’re using an OpenTelemetry SDK, you can send your logs directly to Signoz.
Let’s give you an overview of how OpenTelemetry Collector and OpenTelemetry SDK can collect and send logs to the SigNoz cloud.
Using OpenTelemetry Collector to send logs
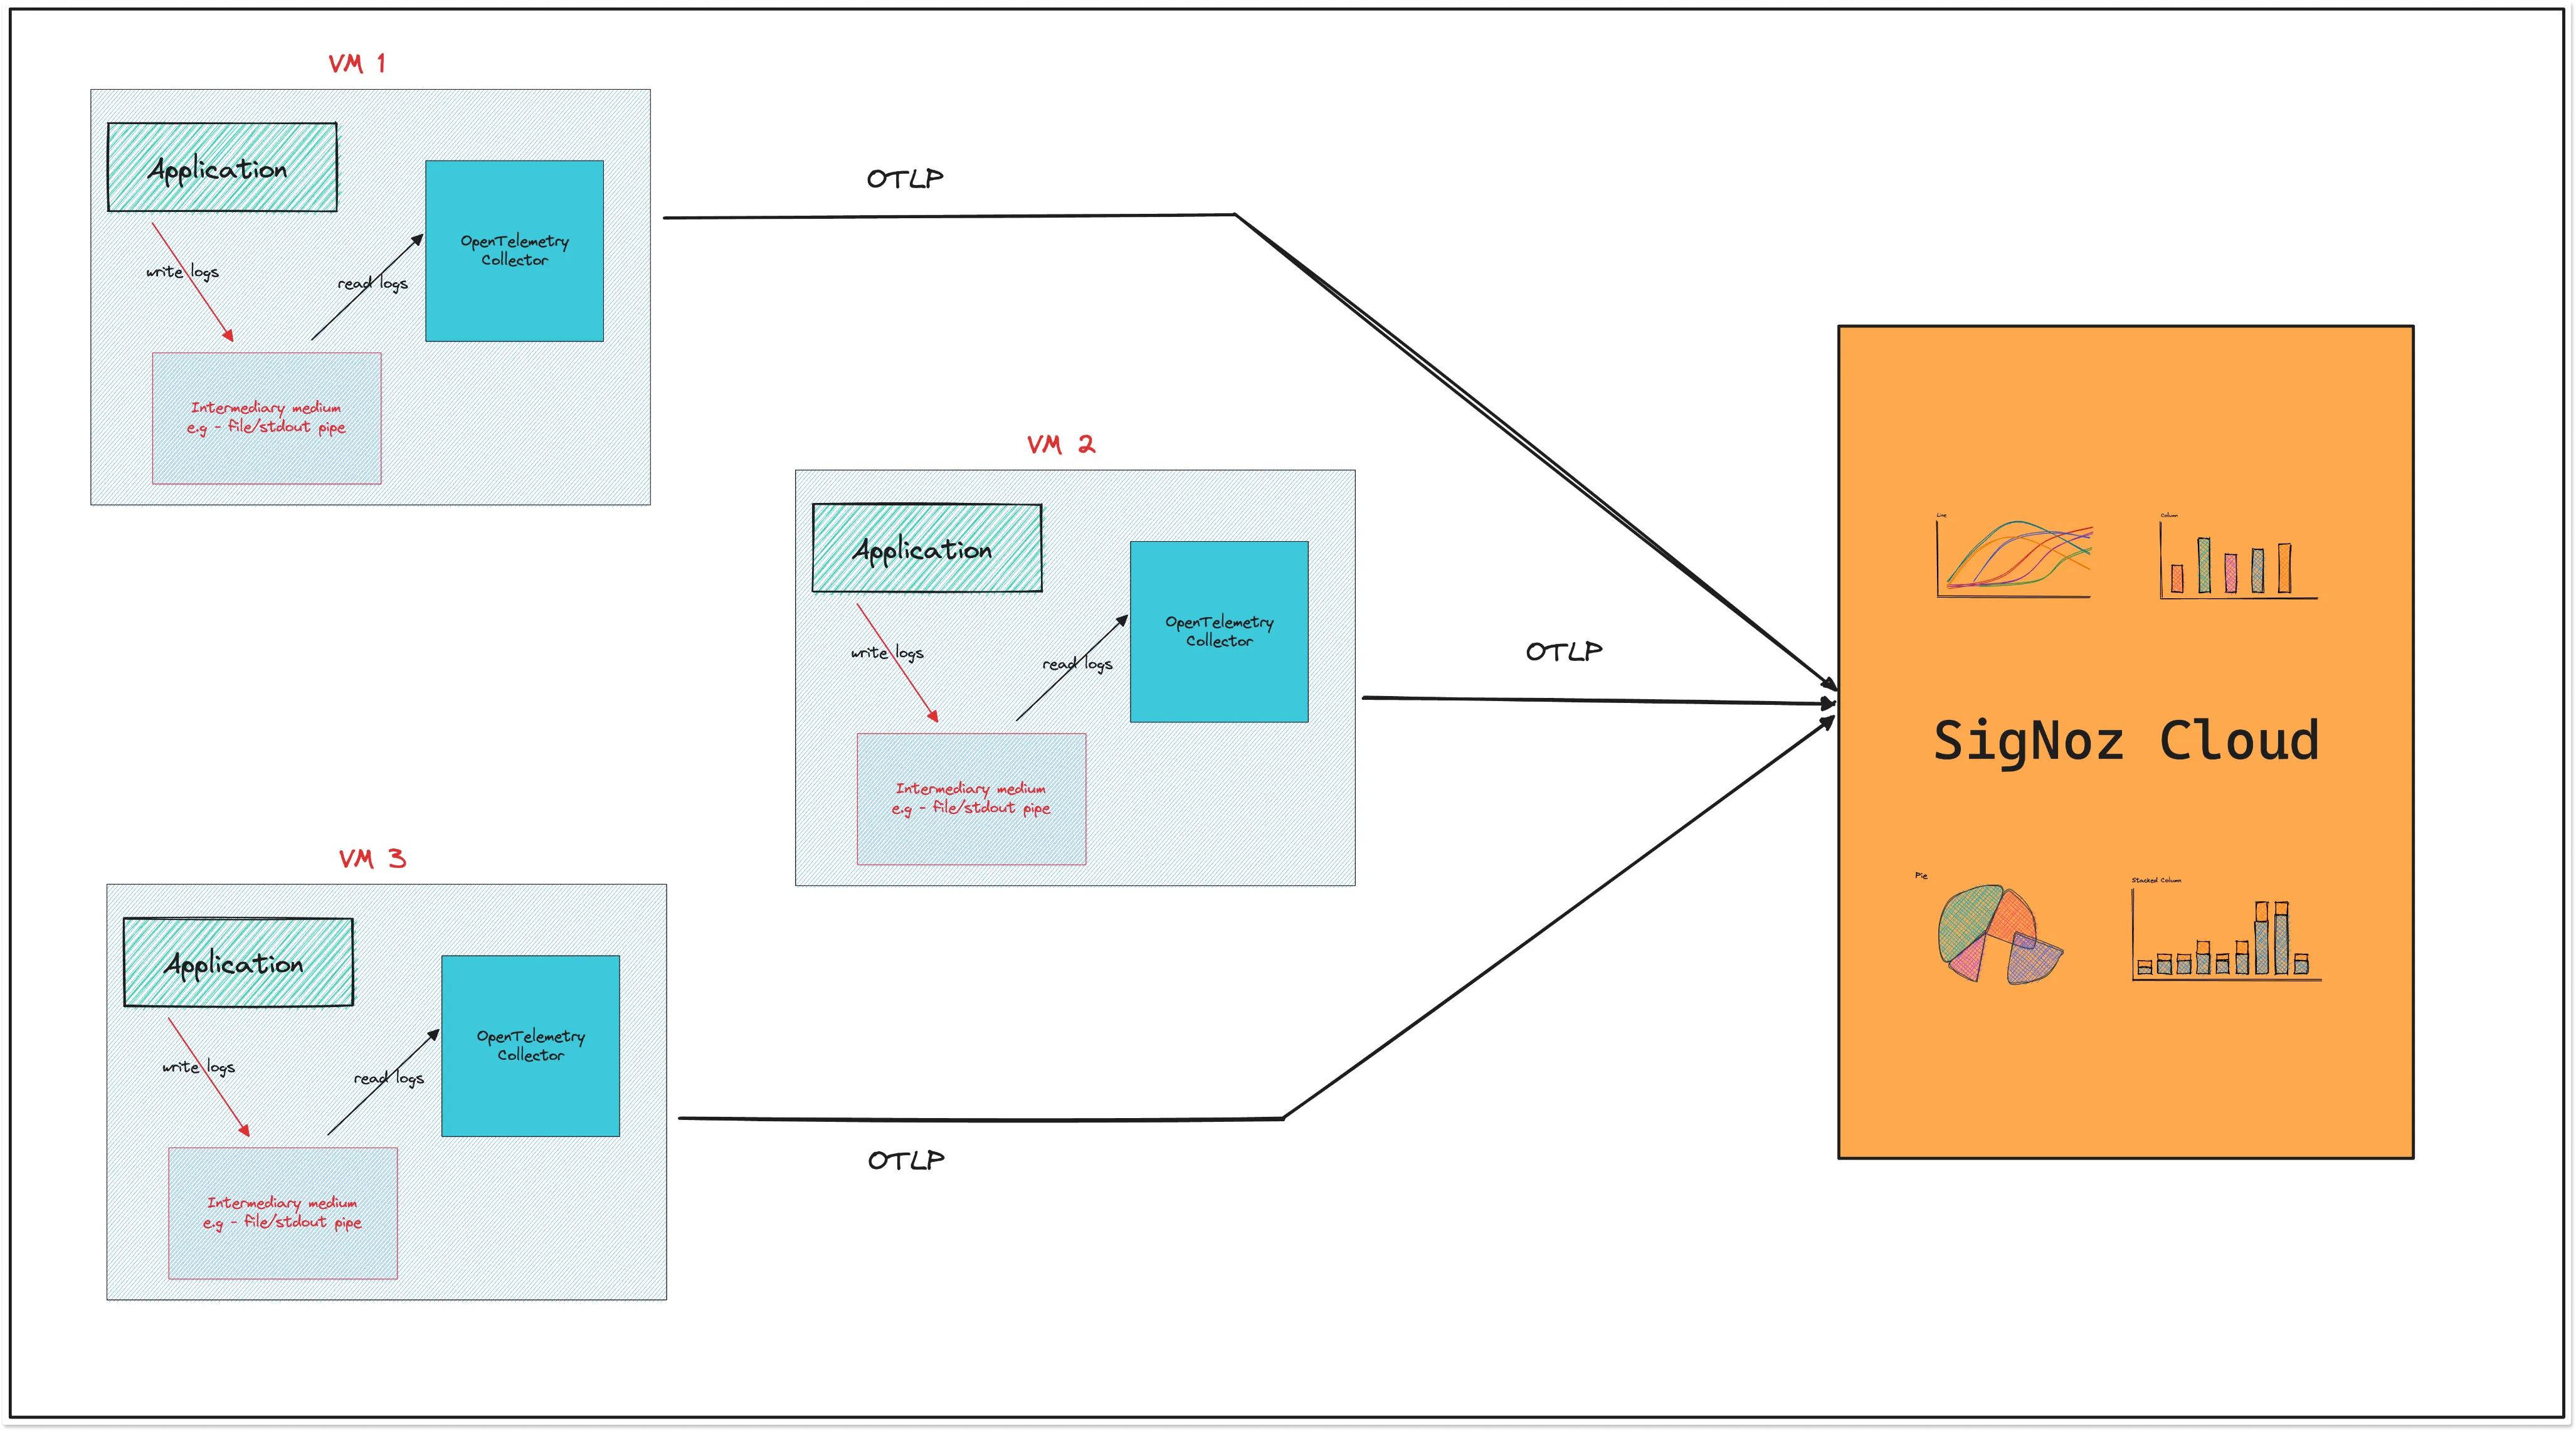
OpenTelemetry collector is a standalone service provided by OpenTelemetry to receive, process, and export telemetry data. You can use it for applications deployed on Kubernetes and VMs. You can also use it if you are using any log shipper like FluentD or Logstash.
Here are different setups with OpenTelemetry Collector that you might set up with your application:
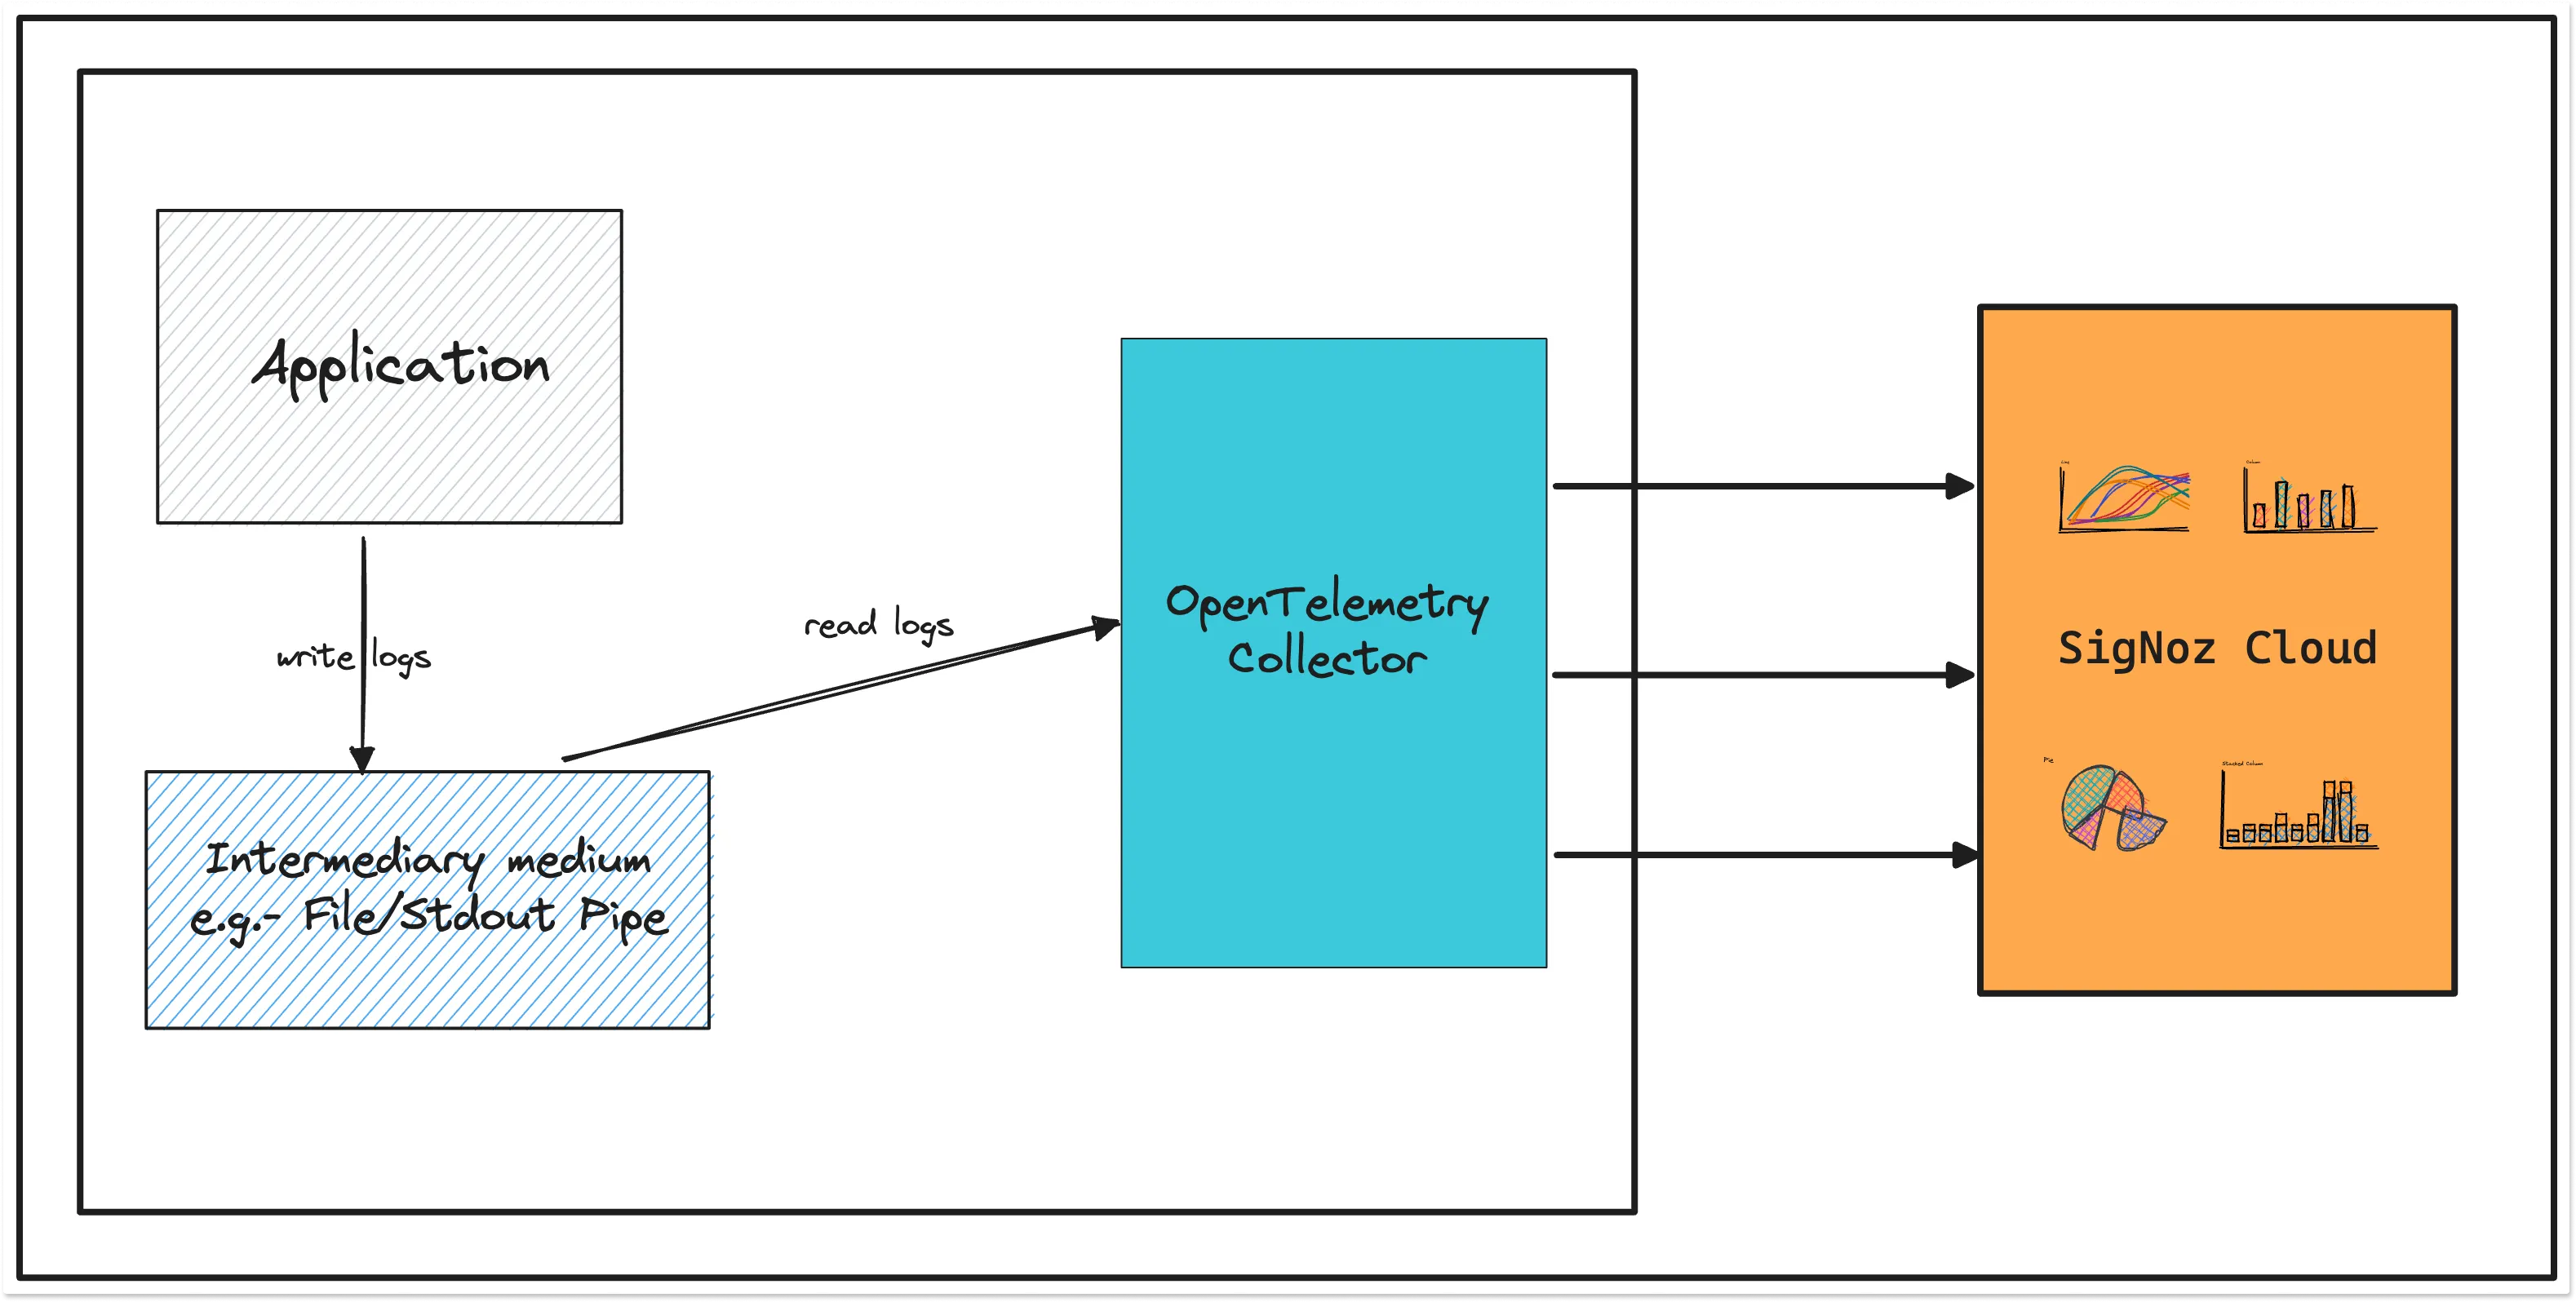
- Via File or Stdout Logs
Here, the logs of the application are directly collected by the OpenTelemetry receiver using collectors like filelog receiver and operators and processors to parse them into the OTel model.
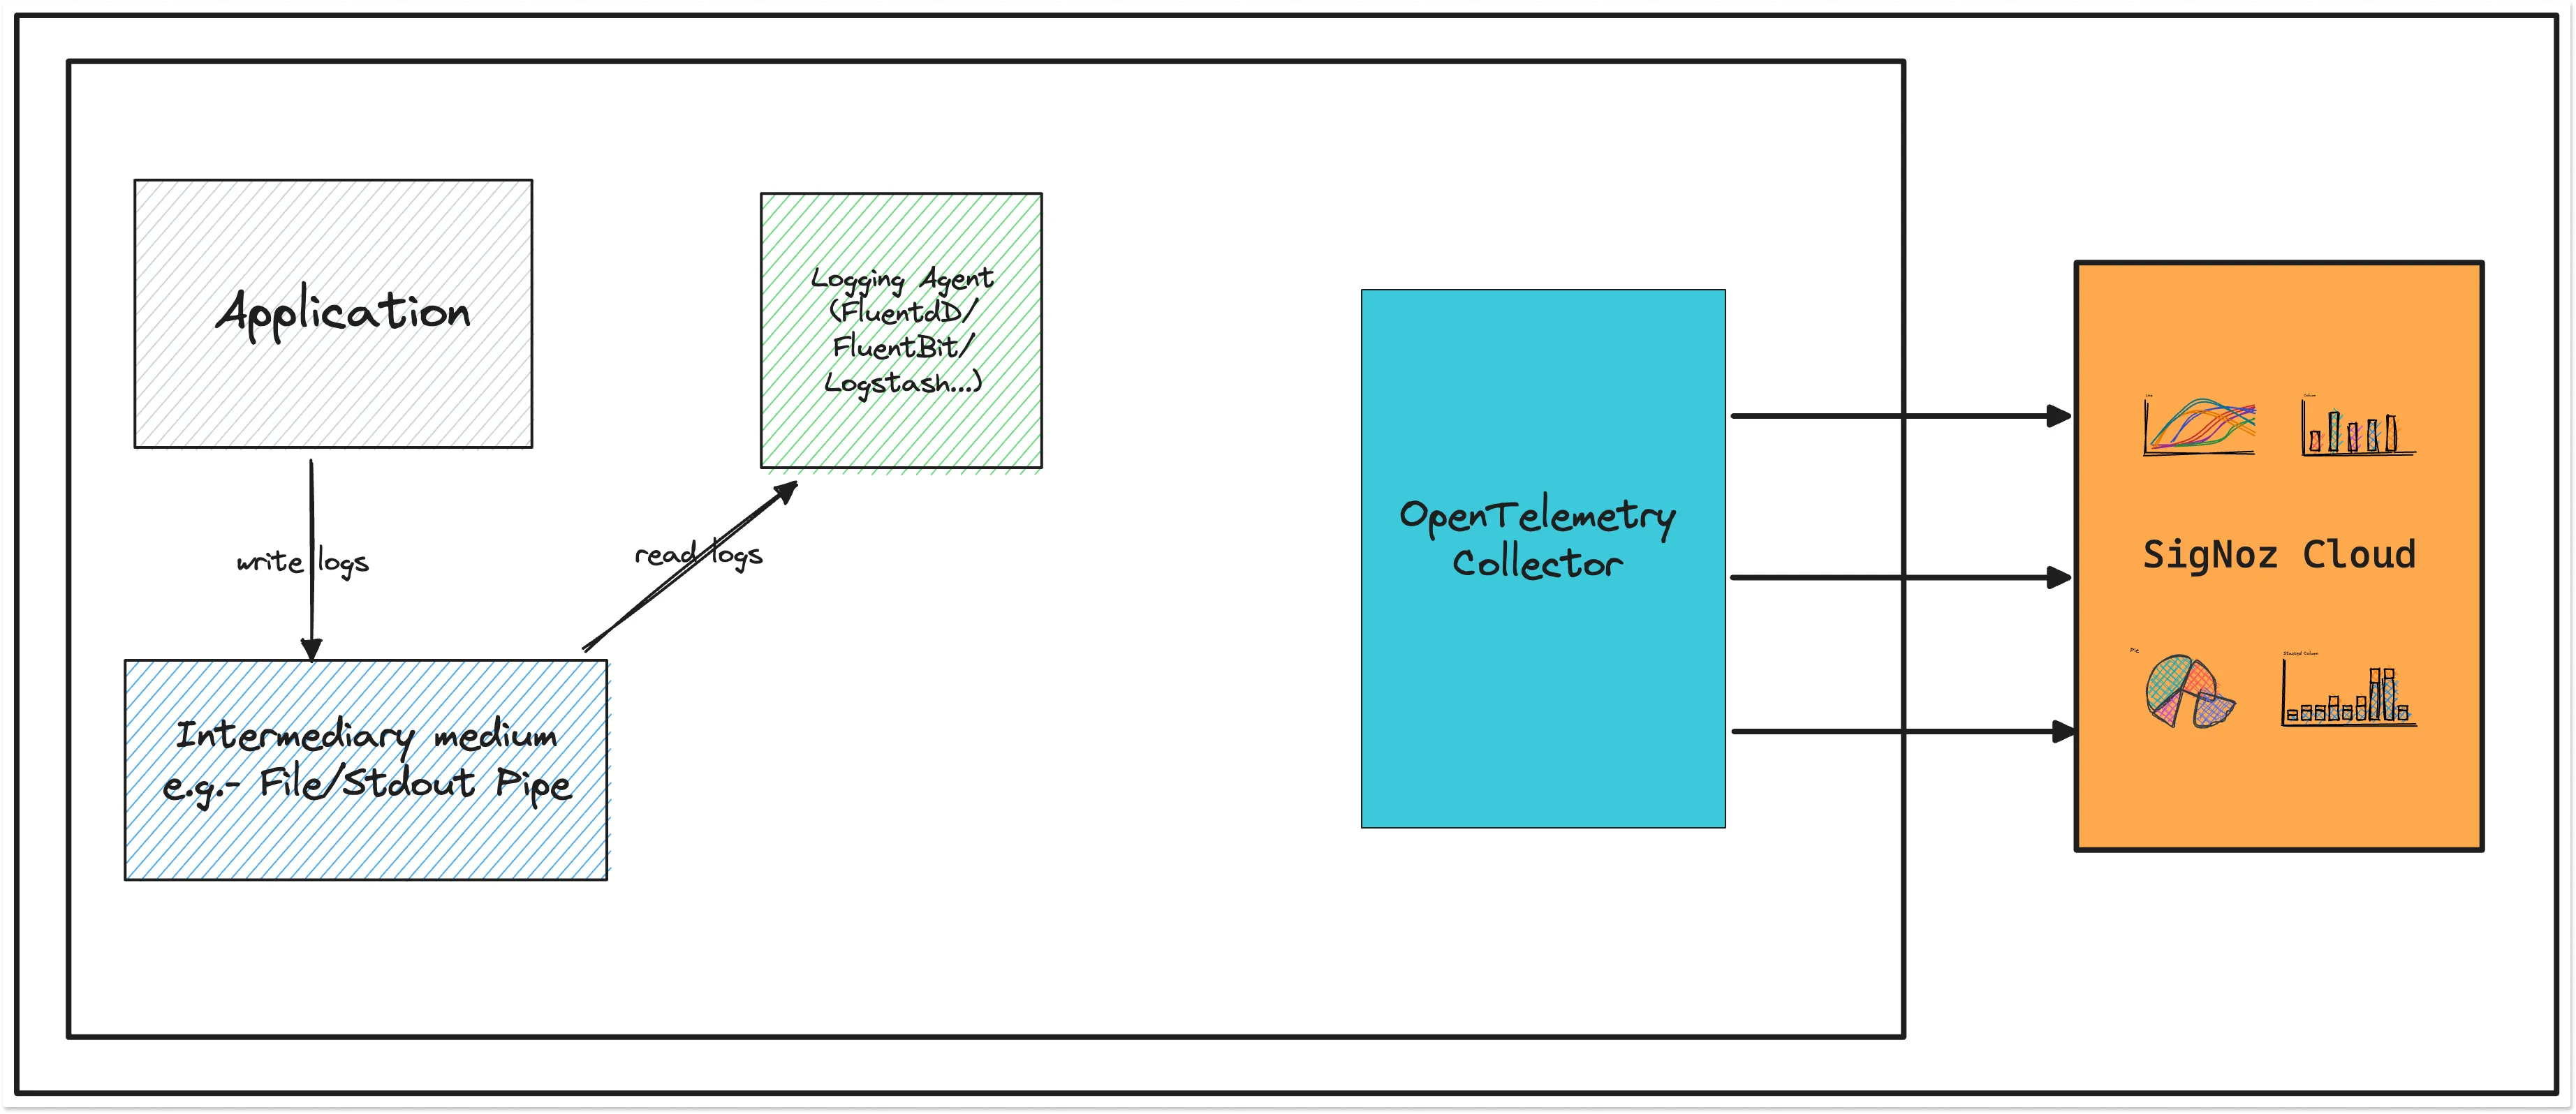
Via a logging agent like FluentD, FluentBit, Logstash
If advanced parsing and collecting capabilities are needed which is not present in OpenTelemetry or something like FluentBit/LogStash etc. is already present, then the agents can push the logs to OpenTelemetry collector using protocols like FluentForward/TCP/UDP, etc.
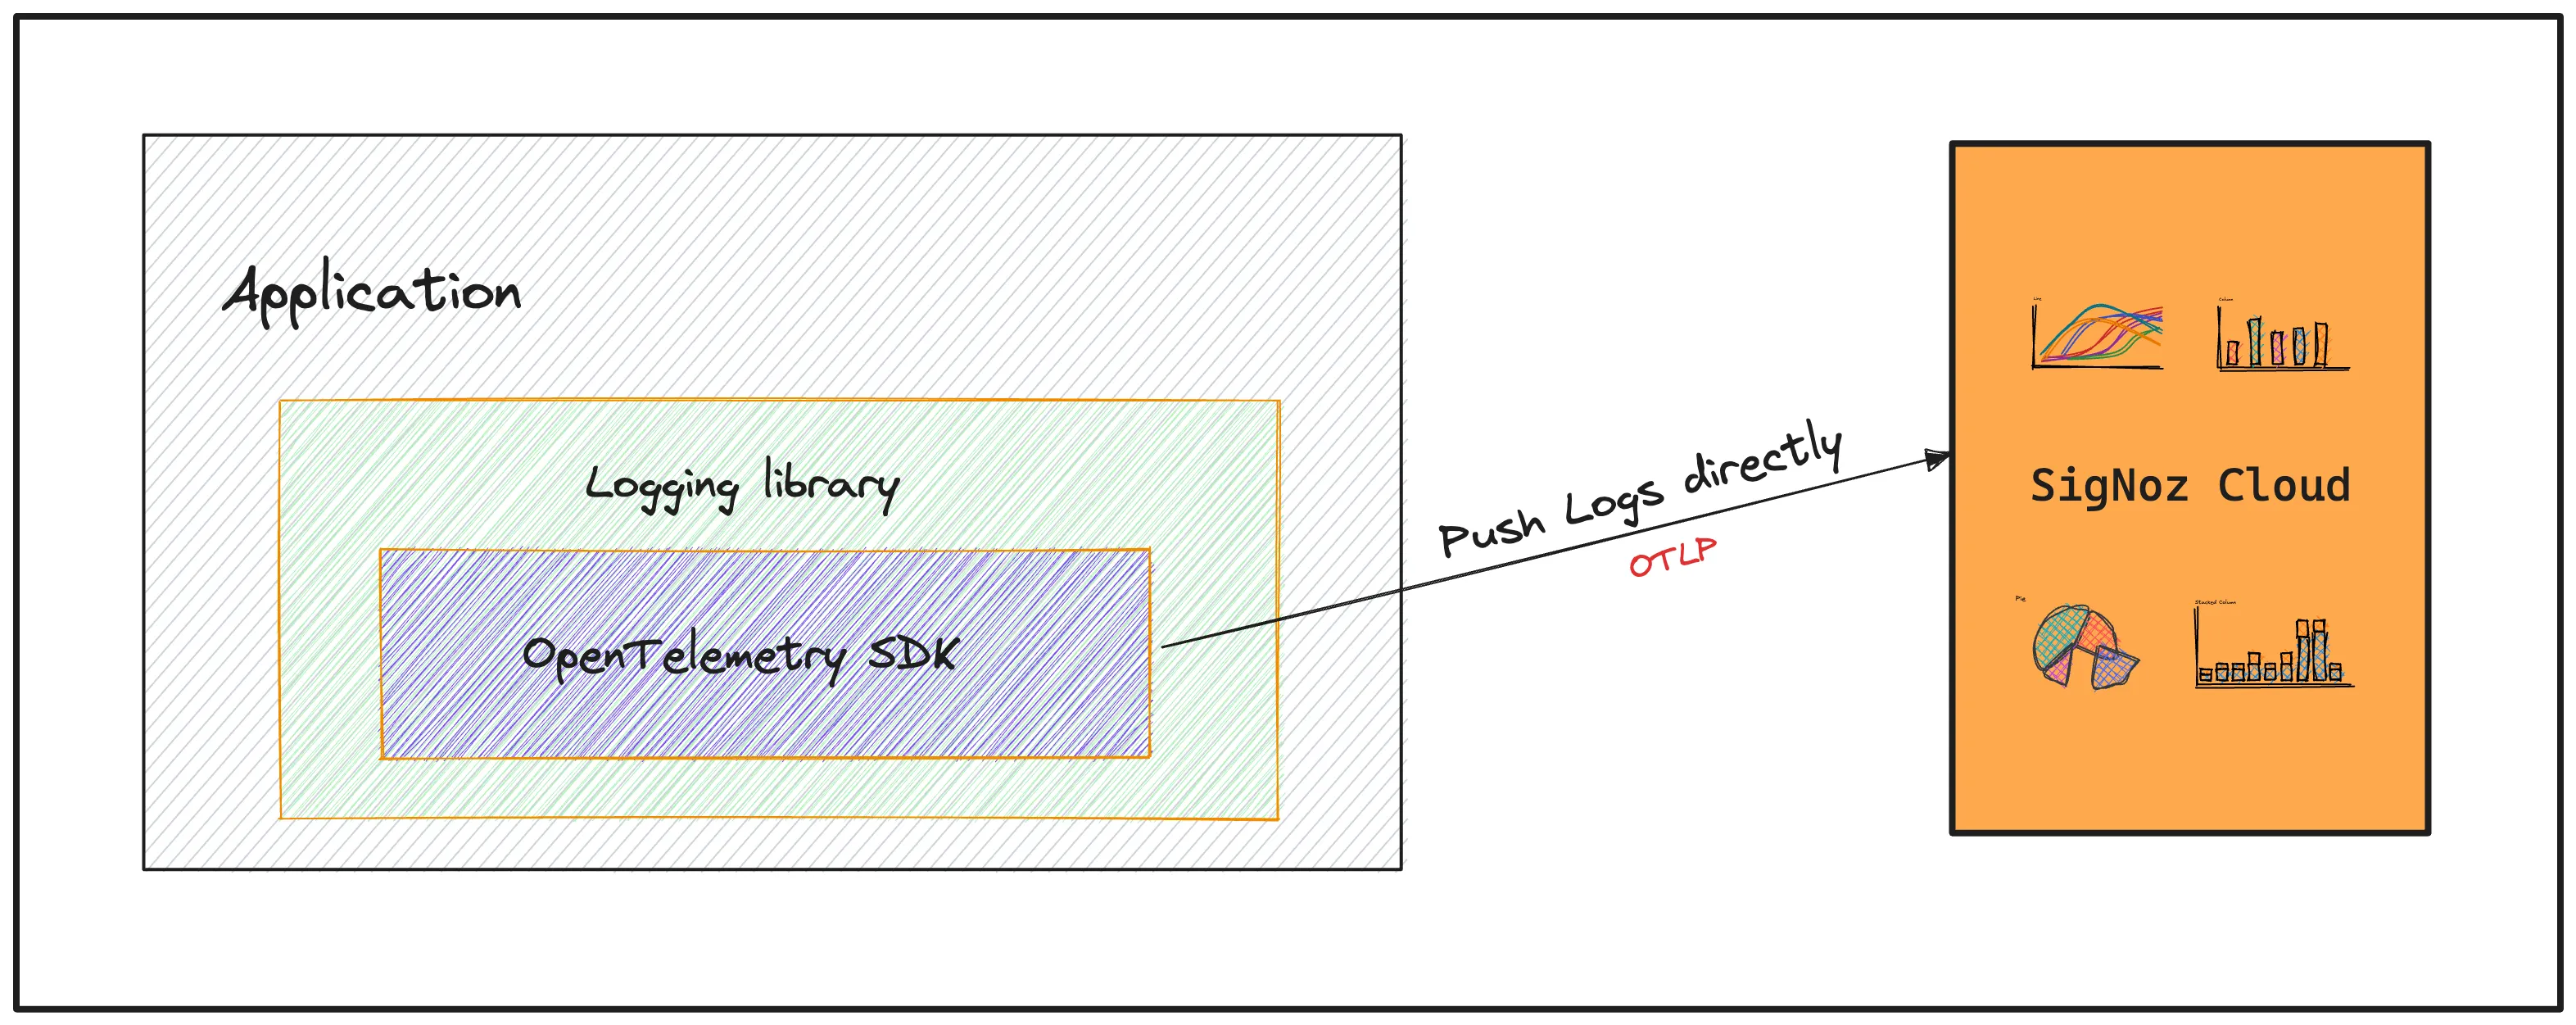
Using OpenTelemetry SDK
In this approach, you can modify your logging library that is used by the application to use the logging SDK provided by OpenTelemetry and directly forward the logs from the application to OpenTelemetry. This approach removes any need for agents/intermediary medium but loses the simplicity of having the log file locally.
Currently, OpenTelemetry logging SDK is available for Python and Java.
Sending logs to SigNoz Cloud based on your environment
Based on your application environment (Kubernetes, VMs, etc.), you need to install and configure OTel Collectors accordingly to collect and send logs.
Please use this exporter for sending logs to SigNoz cloud.
exporters:
 otlp:
   endpoint: "ingest.{region}.signoz.cloud:443"
   tls:
     insecure: false
   headers:
     "signoz-ingestion-key": "<SIGNOZ_INGESTION_KEY>"

...

pipeline:

....

	logs:
	     receivers: [otlp]
	     processors: [batch]
	     exporters: [otlp]
SIGNOZ_INGESTION_KEYis the API token provided by SigNoz. You can find your ingestion key from SigNoz cloud account details sent on your email.
Depending on the choice of your region for SigNoz cloud, the ingest endpoint will vary according to this table.
| Region | Endpoint |
|---|---|
| US | ingest.us.signoz.cloud:443 |
| IN | ingest.in.signoz.cloud:443 |
| EU | ingest.eu.signoz.cloud:443 |
For applications deployed on VMs, you can install otel-binary to collect and send logs to SigNoz. You can find the instructions here.
The otel-binary collects logs from your application and parses them into the OTel model before sending it to the SigNoz cloud.
You can then configure the otlp endpoint for SigNoz cloud to forward logs from your VMs to SigNoz cloud.
Collecting Logs in Self-Hosted SigNoz using OpenTelemetry
SigNoz natively supports OpenTelemetry for collecting logs. OpenTelemetry provides various receivers and processors for collecting first-party and third-party logs directly via OpenTelemetry Collector or via existing agents such as FluentBit so that minimal changes are required to move to OpenTelemetry for logs.
Collecting legacy first-party Application Logs
These applications are built in-house and use existing logging libraries. The logs from these applications can be pushed to OpenTelemetry with little to no changes in application code. If you don’t have request context like traceId and spanId in your logs, you might want to add them for easier correlation with application metrics and traces.
There are two ways to collect logs from these applications.
Via File or Stdout Logs
Here, the logs of the application are directly collected by the OpenTelemetry receiver using collectors like filelog receiver and operators and processors to parse them into the OTel model.
If advanced parsing and collecting capabilities are needed which is not present in OpenTelemetry or something like FluentBit/LogStash etc is already present then the agents can push the logs to OpenTelemetry collector using protocols like FluentForward/TCP/UDP etc.

Direct to collector
In this approach you can modify your logging library that is used by the application to use the logging SDK provided by OpenTelemetry and directly forward the logs from the application to OpenTelemetry. This approach removes any need for agents/intermediary medium but loses the simplicity of having the log file locally.
Collecting third-party application logs
Logs emitted by third party applications running on the system are known as third party application logs. The logs are typically written to stdout, files or other specialized medium (e.g. Windows Event Logs for applications).
These logs can be collected using OpenTelemetry file receiver and then processed or can be collected by a logging agent like FluentD/FluentBit etc and then forward to OTEL collector. The examples of which is discussed in Collecting legacy first-party application logs.
Collecting system logs
These are logs generated by the operating system and over which we have no control. We cannot change the format or affect what information is included. Examples of system format are Syslog and Windows Event Logs.
System logs are written at the host level (which may be physical, virtual or containerized) and have a predefined format and content (note that applications may also be able to write records to standard system logs: this case is covered below in the Third-Party Applications section.
System operations recorded in the logs can be a result of a request execution. However system logs either do not include any data about the request context or if included it is highly idiosyncratic and thus difficult to identify, parse and use. This makes it nearly impossible to perform request context correlation for system logs. However we can and should automatically enrich system logs with the resource context - the information about the host that is available during collection. This can include the host name, IP address, container or pod name, etc. This information should be added to the Resource field of collected log data.
OpenTelemetry Collector can read system logs and automatically enrich them with Resource information using the resourcedetection processor.
Collecting Infrastructure Logs
Like system logs, the infrastructure logs produced by infrastructure components such as Docker and Kubernetes events lack a request context. It can be enriched by the resource context - information about the node, pod, container, etc.
Collecting new first-party Application Logs
It is currently in greenfield development, but OpenTelemetry aims to provide extensions for popular logging libraries that will enrich the logs with relevant context. The extensions will also support sending the logs using OTLP protocol to OpenTelemetry Collector.
Currently OpenTelemetry does’t define a new logging API or create new user-facing logging libraries. The initial goal is to enhance existing popular logging libraries as needed. This is how a typical new application uses OpenTelemetry API, SDK and the existing log libraries

Storing logs in SigNoz
SigNoz has developed its own distro of OpenTelemetry collector which has a custom ClickHouse exporter. This custom version just extends the upstream collector. Everything that works with the upstream collector will work with SigNoz OTEL collector.
This brings a requirement that the final collector should be SigNoz OTEL collector i.e
If you have N number of OpenTelemetry collectors running in different places then they should process and send data to SigNoz OTEL collector using OTLP for it to be able to store in ClickHouse.

The other way is to use SigNoz OTEL collector everywhere which can directly write to ClickHouse.
Log Receivers
A log receiver is how logs data gets into the OpenTelemetry Collector. Different types of receivers supported by OpenTelemetry for logs:
OTLP Receiver - This receiver receives logs over the OTLP protocol in a specified port. Any library which uses OTEL SDK can forward logs to this protocol. This protocol is also used when OTEL collector needs to forward logs to another OTEL collector.
Filelog Receiver - This receiver can tail and parse files containing logs.
Fluent Forward Receiver - This receiver runs a TCP server that accepts events via Fluent Forward Protocol. FluentD and FluentBit can forward logs to this receiver.
TCP Receiver - This receiver runs a TCP server which can receive logs.
UDP Receiver - This receiver runs a UDP server which can receive logs.
Syslog Receiver - This receiver parses syslog received over TCP and UDP
Operators for parsing and manipulating logs
An operator is the most basic unit of log processing. Each operator fulfills a single responsibility, such as adding an attribute to a log field or parsing JSON from a field. Operators are then chained together in a pipeline to achieve a desired result.
For example, a user may parse log lines using regex_parser and then use trace_parser to parse the traceId and spanId from the logs.
The receivers FluentForward and OTLP doesn’t have operators. But for parsing them we can use logprocessor.
- csv_parser :- The
csv_parseroperator parses the string-type field selected byparse_fromwith the given header values. - json_parser :- The
json_parseroperator parses the string-type field selected byparse_fromas JSON. - regex_parser :- The
regex_parseroperator parses the string-type field selected byparse_fromwith the given regular expression pattern. This operator makes use of Go regular expression. When writing a regex, consider using a tool such as regex101 - syslog_parser :- The
syslog_parseroperator parses the string-type field selected byparse_fromas syslog. Timestamp parsing is handled automatically by this operator. - severity_parse :- The
severity_parseroperator sets the severity on an entry by parsing a value from the body. - time_parser :- The
time_parseroperator sets the timestamp on an entry by parsing a value from the body. - trace_parser :- The
trace_parseroperator sets the trace on an entry by parsing a value from the body. - uri_parser :- The
uri_parseroperator parses the string-type field selected byparse_fromas URI - add :- The
addoperator adds a value to anentry'sbody,attributes, orresource. - copy :- The
copyoperator copies a value from one field to another. - filter :- The
filteroperator filters incoming entries that match an expression. - flatten :- The
flattenoperator flattens a field by moving its children up to the same level as the field. The operator only flattens a single level deep. - move :- The
moveoperator moves (or renames) a field from one location to another. - recombine :- The
recombineoperator combines consecutive logs into single logs based on simple expression rules. - remove :- The
removeoperator removes a field from a record. - retain :- The
retainoperator keeps the specified list of fields, and removes the rest. - router :- The
routeroperator allows logs to be routed dynamically based on their content. The operator is configured with a list of routes, where each route has an associated expression. An entry sent to the router operator is forwarded to the first route in the list whose associated expression returnstrue. An entry that does not match any of the routes is dropped and not processed further - key_value_parser :- The
key_value_parseroperator parses the string-type field selected by parse_from into key value pairs. All values are of type string.
Processors available for processing logs
Processors are used at various stages of a pipeline. Generally, a processor pre-processes data before it is exported (e.g. modify attributes or sample) or helps ensure that data makes it through a pipeline successfully (e.g. batch/retry).
Process are also helpful when you have multiple recivers for logs and you want parse/transforms logs collected from all the recievers.
We highly recommend users to use Batch and Memory Limiter Processor with logs
Batch Processor :- The batch processor accepts spans, metrics, or logs and places them into batches. Batching helps better compress the data and reduce the number of outgoing connections required to transmit the data. This processor supports both size and time based batching.
Memory Limiter Processor :- The memory limiter processor is used to prevent out of memory situations on the collector. Given that the amount and type of data the collector processes is environment specific and resource utilization of the collector is also dependent on the configured processors, it is important to put checks in place regarding memory usage. The memory_limiter uses soft and hard memory limits. Hard limit is always above or equal the soft limit.
Attributes Processor :- This processor allows you to modify the attributes of a log.
Filter Processor :- The filter processor can be configured to include or exclude logs based on resource attributes using the strict or regexp match types
Group by Attributes processor :- This processor re-associates log records to a Resource that matches with the specified attributes. As a result, all log records with the same values for the specified attributes are "grouped" under the same Resource.
Logs Transform Processor :- The logs transform processor can be used to apply log operators to logs coming from any receiver.
Resource Detection Processor :- The resource detection processor can be used to detect resource information from the host, in a format that conforms to the OpenTelemetry resource semantic conventions, and append or override the resource value in telemetry data with this information.
Resource Processor :- The resource processor can be used to apply changes on resource attributes.
Transform Processor :- The transform processor modifies telemetry based on configuration using the Telemetry Query Language. The processor takes a list of queries for each signal type and executes the queries against the incoming telemetry in the order specified in the config. Each query can access and transform telemetry using functions and allow the use of a condition to help decide whether the function should be executed.
